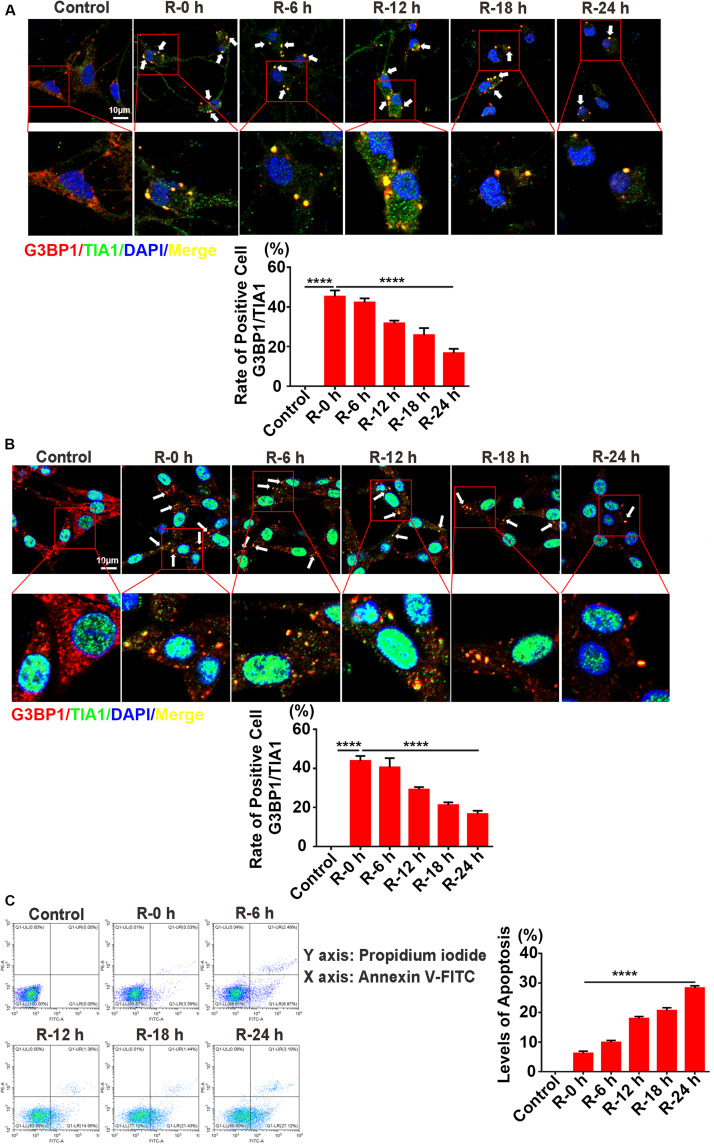
FIGURE 3.
The inverse relation between SG formation and apoptosis levels in PC12 cells and primary cortical neurons under OGD/R stimulation. (A) SG formation in primary cortical neurons treated with different times of reperfusion (0, 6, 12, 18, and 24 h) after 6 h of OGD stimulation. SG labeled with TIA1 (green), G3BP1 (red), and DAPI (blue). (B) SG formation in PC12 cells treated with different times of reperfusion (0, 6, 12, 18, and 24 h) after 6 h of OGD stimulation. (C) Apoptosis levels in PC12 cells treated with different times of reperfusion (0, 6, 12, 18, and 24 h) after 6 h of OGD stimulation. Scale bars: 10 μm. ****P value < 0.0001.

