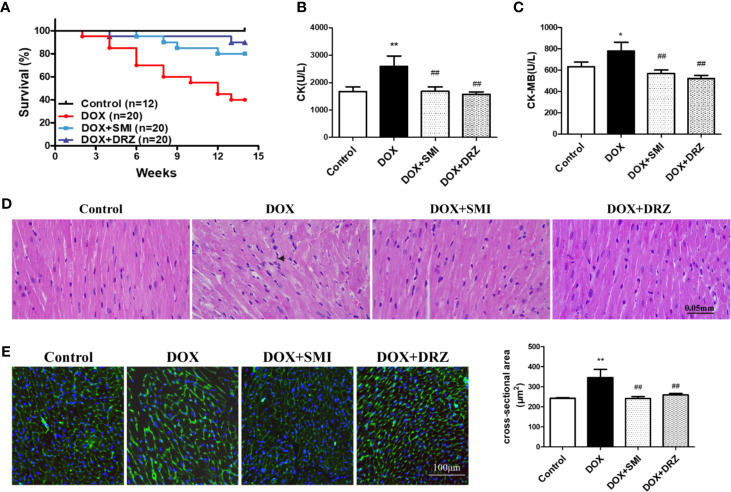
Figure 2.
Effect of SMI on DOX-induced cardiac injury in mice. (A) Survival curves (n = 12 for the control group, n = 20 for the other groups). (B, C) The levels of CK and CK-MB in serum (n = 12 for the control group, n = 8 for the DOX injury group, n = 16 for the SMI treatment group, n = 18 for the DRZ treatment group). (D) HE staining of myocardial sections. Immune cells are marked with short arrows. (E) WGA staining of myocardial sections (n = 3). Ventricular cardiomyocyte cross-sectional area measurements (right). The value represents the mean ± SD. *P < 0.05, **P < 0.01 vs. control group, ##P < 0.01 vs. DOX injury group.

