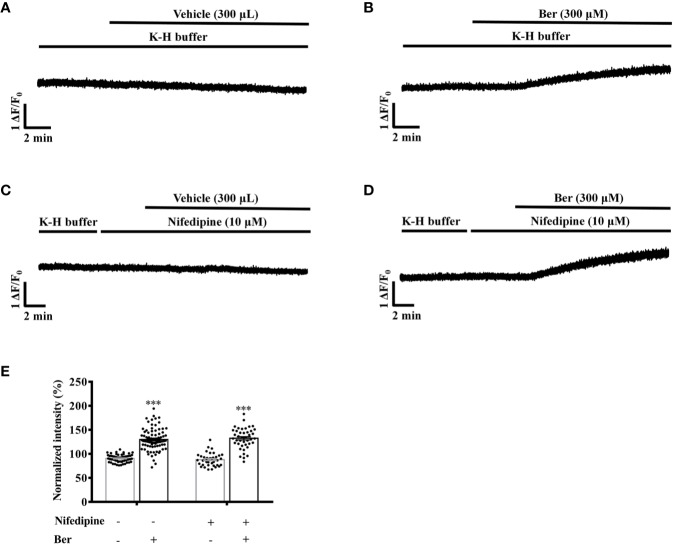
Figure 10.
Nifedipine did not influence the 300 μM berberine-induced increase in the intracellular Ca2+ level of freshly isolated left ventricular (LV) myocytes. (A–D) Original Ca2+ imaging recordings of the LV myocytes treated with vehicle (A), 300 μM Ber (B), 10 μM nifedipine (C) and 300 μM Ber in the presence of 10 μM nifedipine (D). (E) Summary data showing nifedipine did not affect the 300 μM berberine-induced increase in the intracellular Ca2+ level of LV myocytes. The numbers of repeats are as follows: vehicle control of 300 µM Ber, n = 57, N = 4; 300 µM Ber, n = 83, N = 4; 10 μM nifedipine, n = 37, N = 4; 300 µM Ber plus 10 μM nifedipine, n = 46, N = 4; n and N are the numbers of LV myocytes and rats, respectively. Ber stands for berberine. ***p < 0.001 vs. vehicle control group; two-way ANOVA with Tukey's multiple comparisons test.

