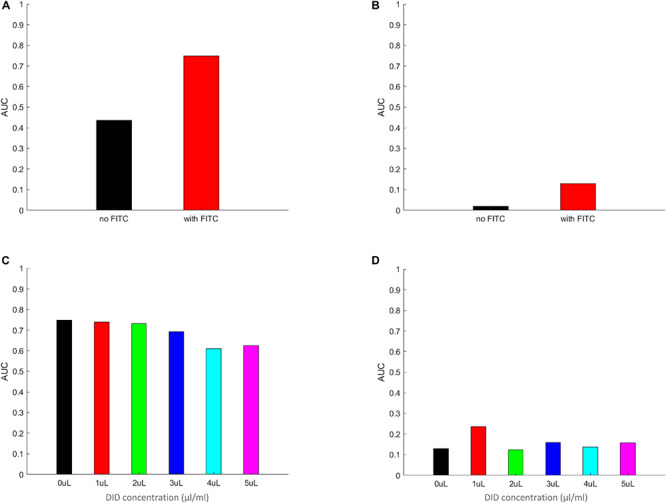
FIGURE 7.

The area under the curve (AUC) of the PDF data from Figure 6. Panels (A–D) the AUC was calculated by multiplying the individual columns by the width of the column in the histograms in panels (A–D) in Figure 6, respectively. The zeroth columns (i.e., the MH-S macrophage cells without any adherent or phagocytosed spores) were left out of the integration. The resulting AUC values are plotted for FITC-free (A) and FITC-labeled (B) spores, as well for MH-S cells labeled with various concentrations of DID, (C,D), applying the same color scheme as in Figure 6 for easier comparison between Figures 6, 7. The AUC calculated by using the equal weight of 1 for each column from Figure 6 results in a value that mimics the symmetrized phagocytic index of the corresponding fungal species and staining conditions.
