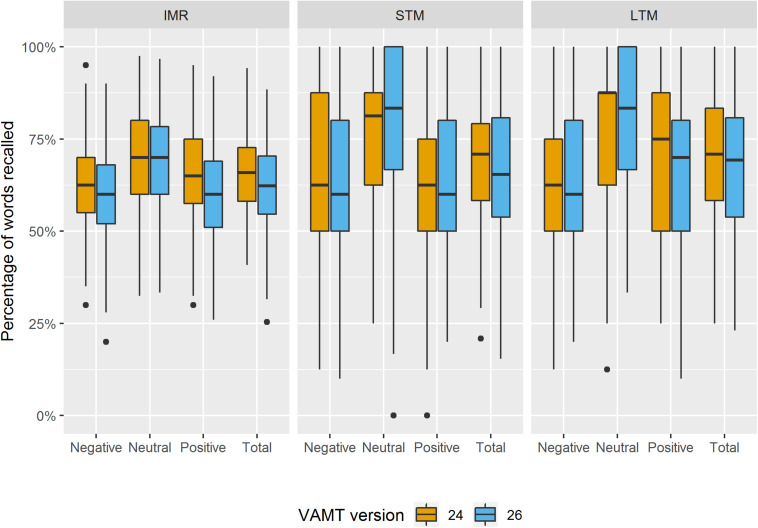
FIGURE 4.
Boxplots of distribution of the percentage of VAMT-24 and VAMT-26 recall outcomes. The boxplots show the distribution of the percentage of words recalled in total and within each valence (i.e., Positive, Negative, and Neutral) across the IMR trials 1–5, the STM trial and the LTM trial for VAMT-24 and VAMT-26, respectively. Outliers are identified as scores that fall below first quartile – 1.5 × IQR or above third quartile + 1.5 × IQR. Outliers are plotted as individual points.

