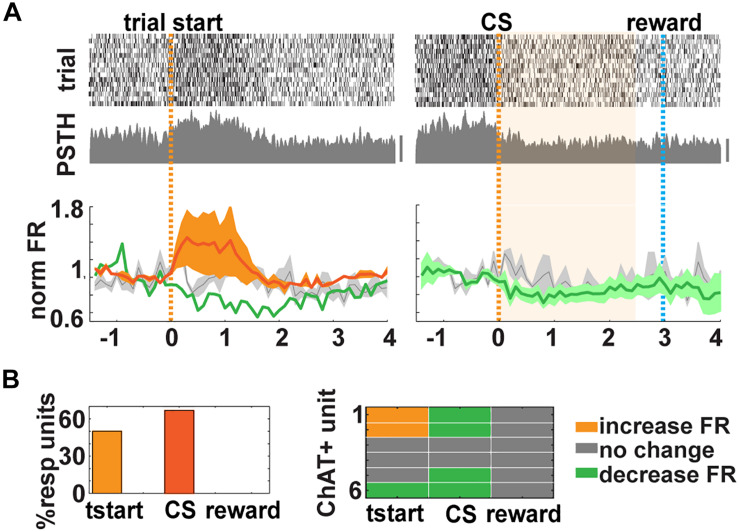
FIGURE 4.
Cholinergic neurons (CNs) respond to trial start in the go/go–no (GNG) task. (A) Top and middle. Examples of responses for units classified as cholinergic. Top, raster plot of 15 trials aligned by trial start (orange dashed line, left) or conditioned stimulus (CS) presentation (right, light blue dashed line: water delivery or reward, bar 50 Hz). Middle, peristimulus time histogram (PSTH). Bottom, mean normalized firing rate (FR) for six identified CNs (increase: orange; decrease: green; no change: gray). Shaded area represents the SD of the mean. (B) Summary of CNs responses. Left, percent responding to tstart (66.7%), CS (83.3%), and reward (0%). Right, comparison of the CNs responses in all events.

