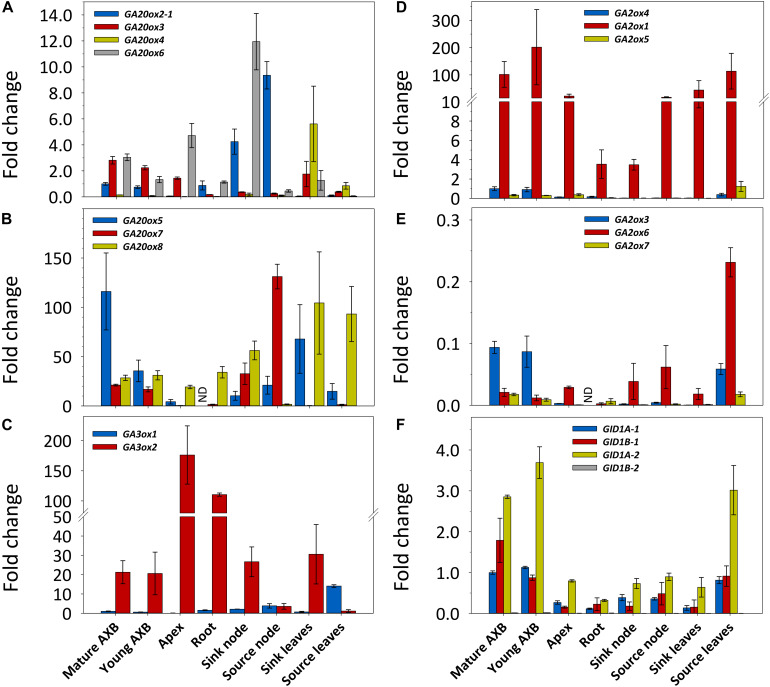
FIGURE 2.
Expression of gibberellin (GA) biosynthesis, deactivation and signaling genes in different plant parts in hybrid aspen. Relative expression (fold change) of GA20ox (A,B), GA3ox (C), GA2ox (D,E), and GID1 (F) family genes. The two larger gene families are depicted in two separate graphs with high (B,D) and little (A,E) expressed genes. Values represent the means of three biological replicates ± S.E. (n = six plants). ND, not detected. Fold changes are relative to reference gene expression in quiescent AXBs, set to 1. A moderately expressed gene within each family was selected for comparison: GA20ox2-1, GA3ox1, GA2ox4, and GID1A-1.

