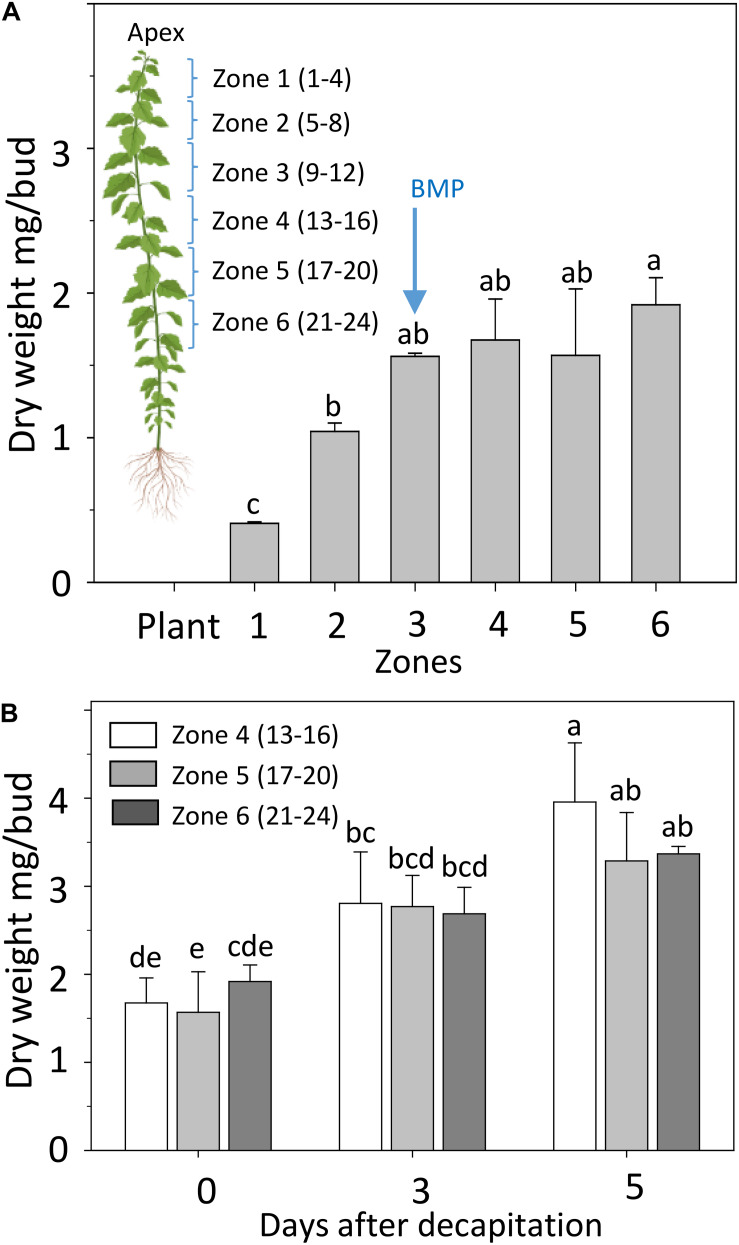
FIGURE 3.
Development of AXBs. (A) AXBs in different zones along the stem in intact plants. The numbers in parenthesis of zones indicate the position of AXBs, counted from the top. (B) AXB enlargement after decapitation in the remaining zones 4–6. Values represent the means of three biological replicates ± S.E. (n = six plants). One-way ANOVA. Different letters indicate statistical differences between samples (Fischer’s LSD post hoc analysis; P-value at least < 0.05).

