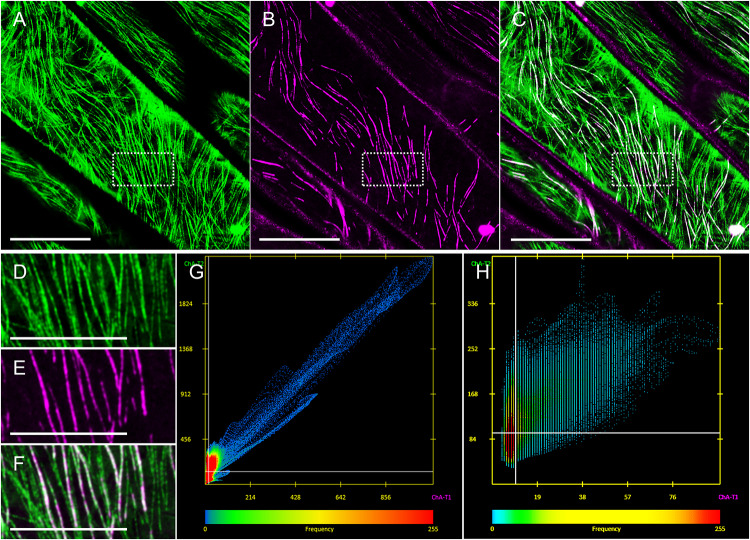
FIGURE 4.
Demonstration and analysis of MAP65-2 colocalization with cortical microtubules. Hypocotyl epidermal cells of stably transformed seedlings expressing both tagRFP-MAP65-2 and TUA6-GFP as visualized by ACLSM (objective 63×/1.40 NA). (A–C) Overview of TUA6-GFP labeled microtubules (A), tagRFP-MAP65-2 (B), and their overlay (C). (D–F) Magnified views of the boxed area of (A–C) showing again TUA6-GFP tagged microtubules (D), tagRFP-MAP65-2 (E) and the resulting merged image (F). (G,H) Scatterplots showing spatial correlation of green vs. red pixels for the entire field of view shown in C (G) or corresponding to the rectangular ROI (boxed area of C; H). Scale bars = 10 μm, (A–C); 5 μm, (D–F).

