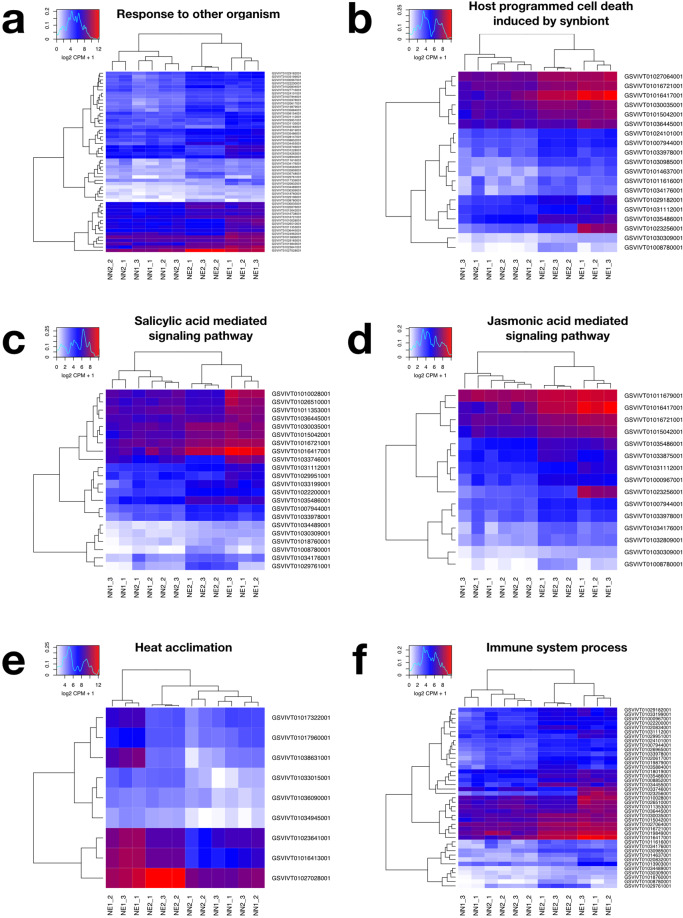
Figure 3.
Part of the Gene Ontology enrichment results in a heatmap representation. Each column of a given heatmap represents a biological repetition of a given condition and each line represents a DE gene of given gene ontology classification. Expression values are presented as logarithmic base 2 of normalized Counts Per Million (CPM) across samples plus 1. Highly expressed genes are colored in red hues whereas lower expressed genes are colored in blue. (a) Response to other organism (GO:0051707); (b) host programmed cell death induced by symbiont (GO:0034050); (c) salicylic acid mediated signaling pathway (GO:0009863); (d) jasmonic acid mediated signaling pathway (GO:0009867); (e) response to oxidative stress (GO:0006979), and (f) immune system process (GO:0002376).

