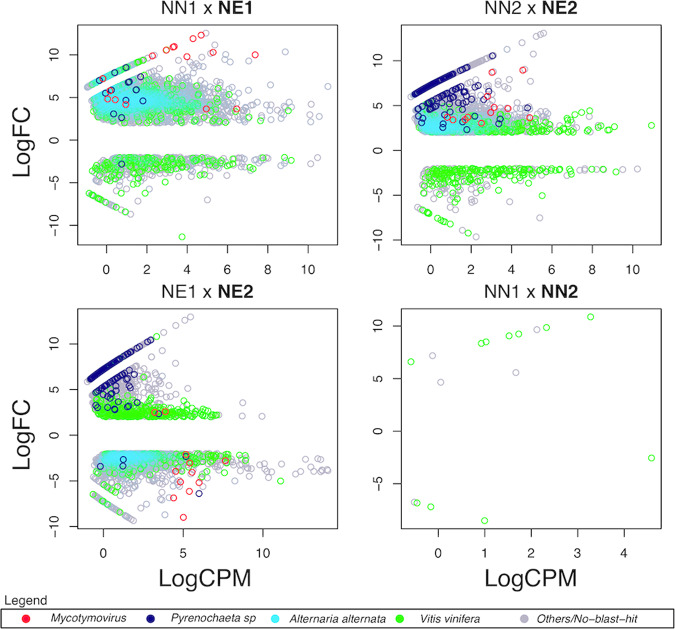
Figure 6.
Dot plot representation of the statistically significant DE genes in the meta-transcriptome assembly. Y-axis represents the expression value in logarithmic base 2 of fold change. This metric summarizes the relative expression of a gene across the compared conditions. X-axis represents the logarithmic base 2 of the mean of Count Per Million values across all samples. This metric summarizes the confidence in the DE result. Red: Mycotymovirus, Dark blue: Pyrenochaeta sp., Light blue: Alternaria alternata, Green: Vitis vinifera, Grey: Others or without blast hit.

