
Figure 5.
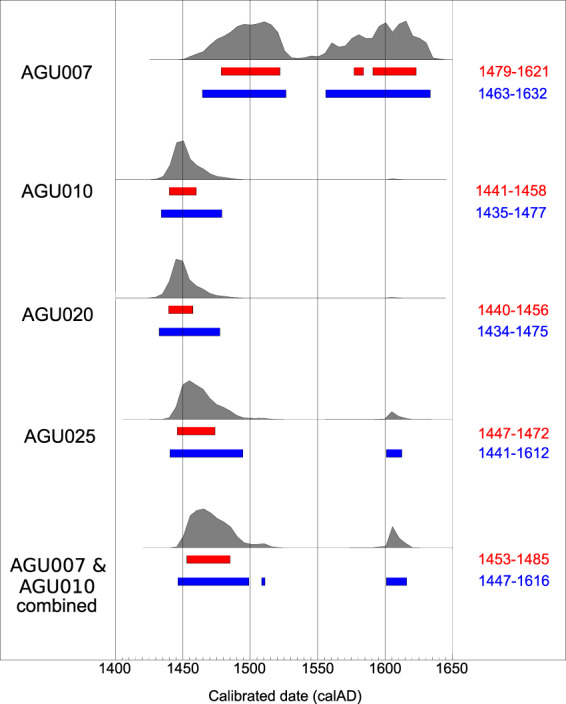
Comparative radiocarbon distribution plots for the individuals with confirmed plague infection. AGU007 (MAMS40889): 14C age = 353 ± 18 yrBP, AGU010 (MAMS40326): 14C age = 426 ± 19 yrBP, AGU020 (MAMS40328): 14C age = 428 ± 19 yrBP, AGU025 (MAMS40329): 14C age = 405 ± 18 yrBP. Sigma-1 ranges are shown in red, sigma-2 in blue. The curve for the combined plots of individuals AGU007 and AGU010 is also shown. (created with Oxcal v4.3.282).