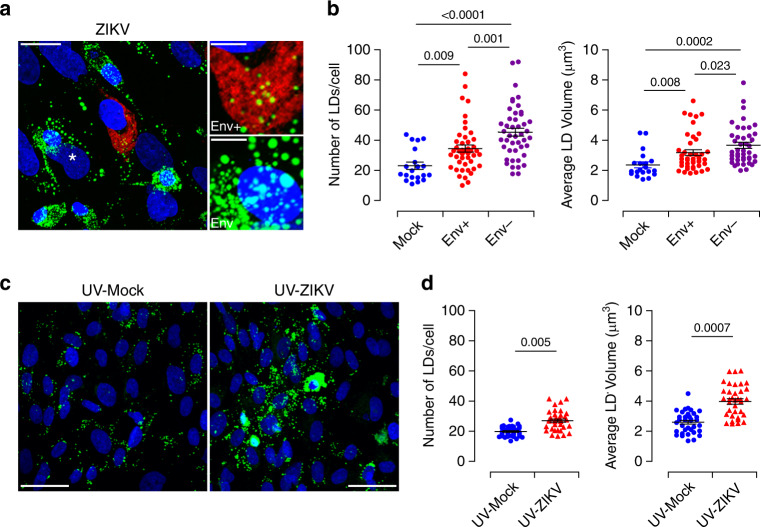
Fig. 5. Bystander effect of ZIKV infection on LD biogenesis.
Placental cells were infected with ZIKV MOI of 1 for five days. a LD staining with the BODIPY 493/503 dye (green), anti-Flavivirus group antigen antibodies (Env) staining distinguishes ZIKV+ (red) from ZIKV− bystander cells (asterisk). High-magnitude images of LD are shown in the right panels. Scale bar, 20 μm. High magnification image insets showing LDs in both ZIKV+ (Env+) and ZIKV− (Env−) bystander. Scale bar, 5 μm. b Morphometric measurements of LD number and volume based on Z-stack projections of confocal images. Data from five different donors are shown as dot plot graphs. Each data point represents the average number of LDs per cell and average volume from mock (blue) and ZIKV-infected cells (red) or bystander neighboring cells (violet). Results are presented as mean values ± SEM and analyzed by one-way ANOVA, with Dunnett’s multiple comparison test. c Supernatants from mock- or ZIKV-infected primary placental cells were collected from five independent donors 5 dpi and UV-irradiated. Freshly isolated placental cells are challenged with the UV-irradiated supernatants for 3 days. Immunofluorescence staining of LDs with the BODIPY 493/503 dye (green), ZIKV Env protein (red) and nuclei (DAPI in blue). Scale bar, 50 μm. d LD number and volume analysis by Imaris software. Each data point represents the average number of LDs per cells and average volume from Mock- (blue) and ZIKV+ cells (red). Results are presented as mean values ± SEM and analyzed by two-tailed Student’s t test. Source data are provided as a Source Data file.

