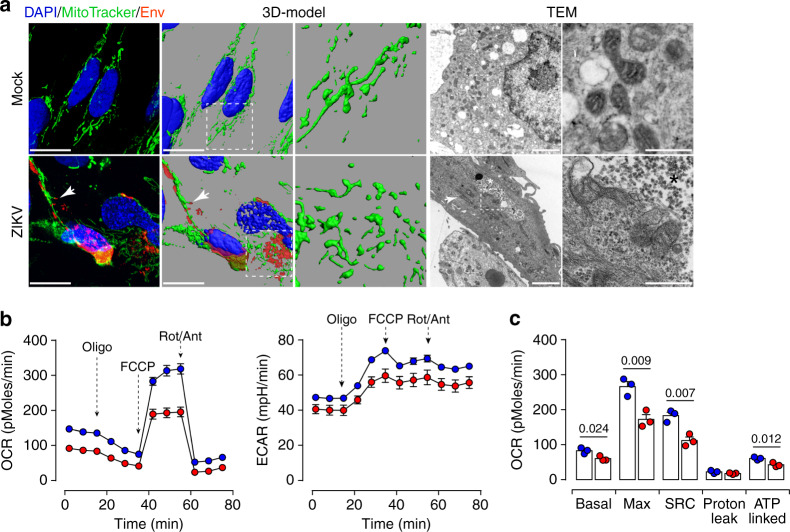
Fig. 8. ZIKV infection impairs mitochondrial network distribution and respiratory capacities.
a Z-stack projection of confocal images from mock- and ZIKV-infected placental cells are stained with MitoTracker Deep Red FM (green) and anti-Flavivirus group antigen antibodies (Env, red). Nuclei are stained with DAPI (blue). 3D-view models are reconstructed by Imaris software. Scale bar, 20 μm. TEM micrographs showing the distribution in mock- and ZIKV-infected cells. Elongated size mitochondria are found in ZIKV-infected cells (white arrow). Scale bar, 2 μm. The white rectangle denotes the enlarged region shown in right magnification panels. Clustered viral particles (*) are found in close proximity with abnormal mitochondria. Scale bar, 500 nm. b OCR measured in mock- and ZIKV-infected placental cells by Seahorse XFp analyzer. c Bar graphs comparing OCR parameters: basal, maximal and spare respiratory capacities (SRC), and ATP-linked OCR. Data are presented as mean values ± SEM from three independent donors. P values are computed using two-tailed Student’s t test. Source data are provided as a Source Data file.

