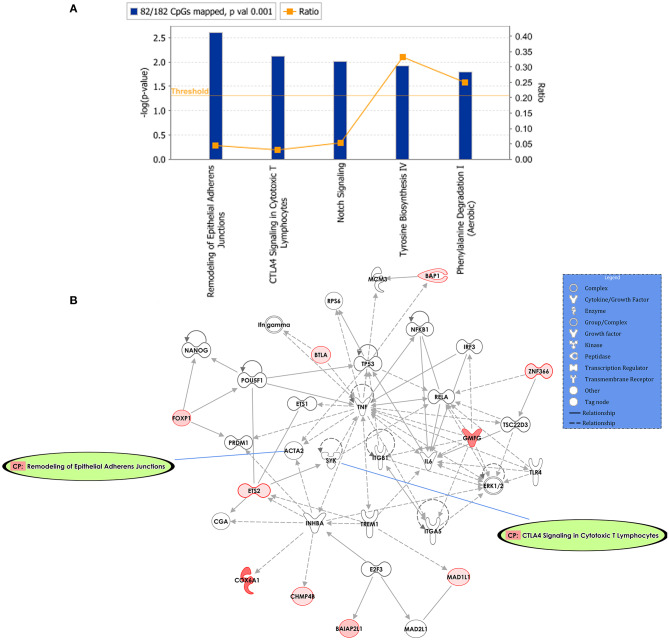
Figure 2.
Potential biological roles of the differentially methylated genes (p ≤ 0.001) from the regression model considering IgG titers. (A) Affected canonical pathways based on the differentially methylated genes in the study. The line defining threshold with a score of 1.3 represents the -log (p-value 0.05) on the y-axis of the bar chart. The height of the bar is related to the significance on the overlap of the analyzed genes with the pathway, and the ratio indicates the number of uploaded genes over the total number of genes involved in each of the pathway. (B) Top network and overlay of two related canonical pathways. The network is related to cell death and survival, cell cycle, and cellular development. Nodes (genes) and edges (gene relationships) are described in the legend. The intensity of the node color (red) denotes the degree of upregulation (redder is more significant according to the p-value). Uncolored nodes were integrated into the network based on evidence stored in the Ingenuity Knowledge Base.

