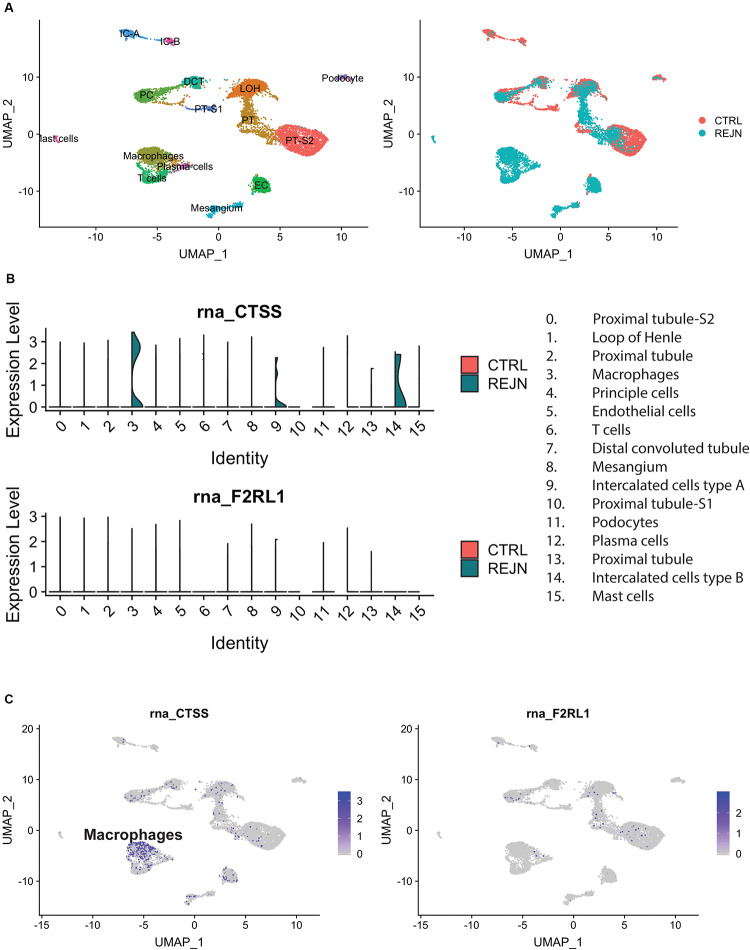
FIGURE 1.
Cat-S and PAR-2 gene expression in healthy and rejected human kidney biopsies by single-cell RNA-seq. (A) UMAP plots of combined correlation analysis of a mixed rejection kidney transplant biopsy and a healthy human kidney tissue sample. Left: cell clusters labeled by cell type. Right: clusters labeled according to rejection (blue) or healthy (red) kidney. (B) Violin plots of Cat-S (CTSS) and PAR-2 (F2RL1) gene expression per cell type, in rejection (green) and healthy (red). Upper: CTSS expression. Lower: F2RL1 expression. (C) Feature UMAP plots of Cat-S (left) and PAR2 (right) expression. Purple color demotes high gene expression.

