Figure 2.

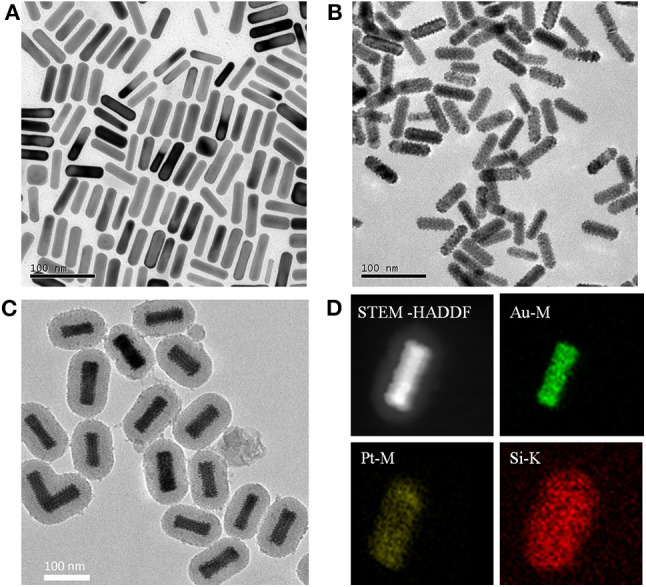
Typical TEM images of (A) Au NRs, (B) Au@Pt NRs, and (C) APMSNs. (D) STEM-HAADF image and STEM-EDX maps of Au, Pt, and Si, respectively.

Typical TEM images of (A) Au NRs, (B) Au@Pt NRs, and (C) APMSNs. (D) STEM-HAADF image and STEM-EDX maps of Au, Pt, and Si, respectively.