Figure 8.

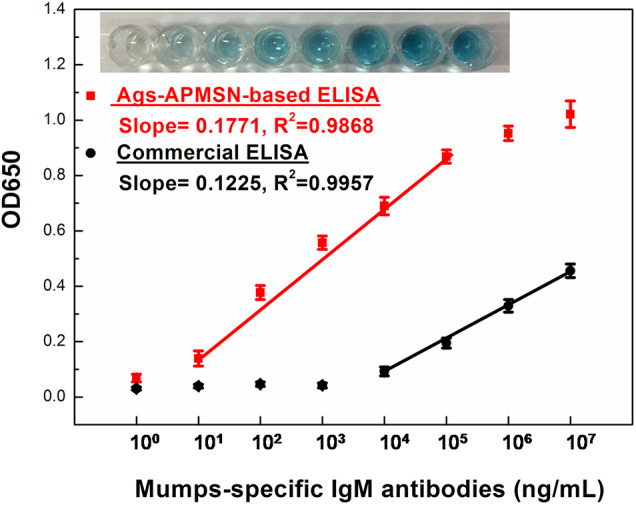
Calibration plot of absorption values at 650 nm vs. mumps-specific IgM antibodies at different concentration. The insets are the typical photograph of the wells of the Ags-APMSN-based ELISA.

Calibration plot of absorption values at 650 nm vs. mumps-specific IgM antibodies at different concentration. The insets are the typical photograph of the wells of the Ags-APMSN-based ELISA.