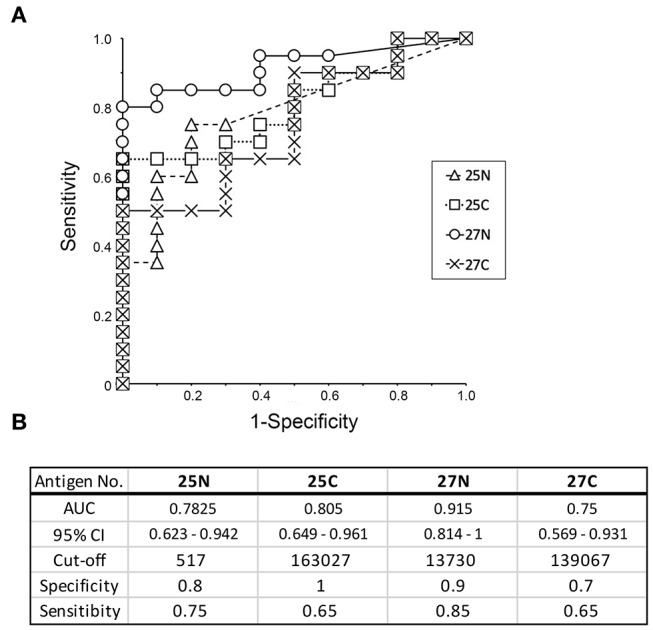
Figure 7.

Receiver operative characteristic (ROC) curve analysis to evaluate the diagnostic capacity of individual recombinant antigens (25N, 25C, 27N, and 27C) to distinguish between periodontitis patients and healthy individuals. (A) ROC curves were generated as described by Ekuseru-Toukei 2010 (Social Survey Research Information Co., Ltd.) using the spot intensities from the dot blot analysis (Figure 6). (B) The values of AUC with 95% confidence interval (CI) and sensitivity/specificity with optimal cut-offs are presented in the lower panel. N, N-terminal half; C, C-terminal half.
