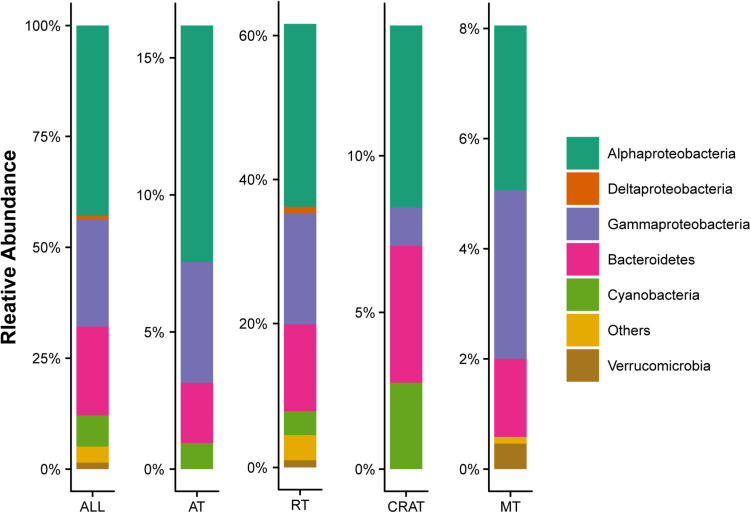
FIGURE 2.
Composition structure of bacterial communities in stream biofilms. Only the dominant phyla with relative abundance >1% are shown. “All” represents the whole communities. “AT,” “RT,” “CRAT,” and “MT” represent subcommunities of abundant taxa, rare taxa, conditionally rare and abundant taxa, and moderate taxa, respectively.

