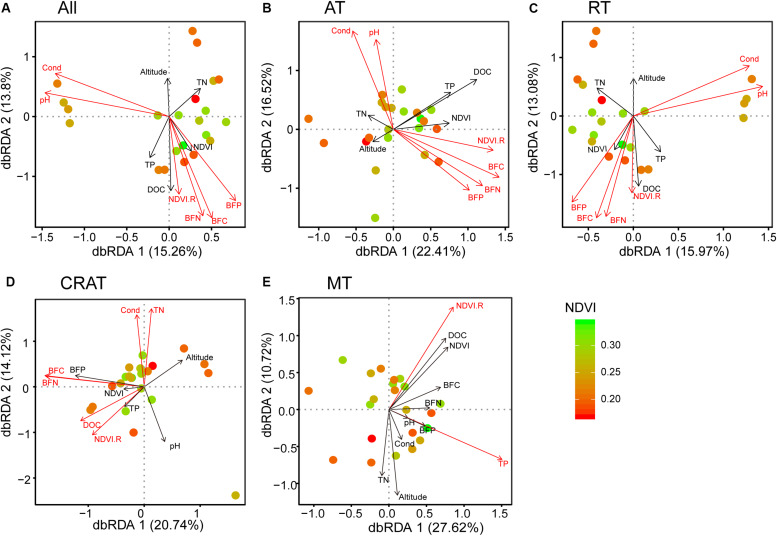
FIGURE 3.
Distance-based redundancy analyses (dbRDA) reveal the relationships between bacterial communities (points) and environmental variables (arrows). Points are colored by normalized difference vegetation index (NDVI). Significant variables (P < 0.05 by envfit function) are shown in red. (A) “All,” (B) “AT,” (C) “RT,” (D) “CRAT,” and (E) “MT” represent the whole communities and the subcommunities of abundant taxa, rare taxa, conditionally rare and abundant taxa, and moderate taxa, respectively.

