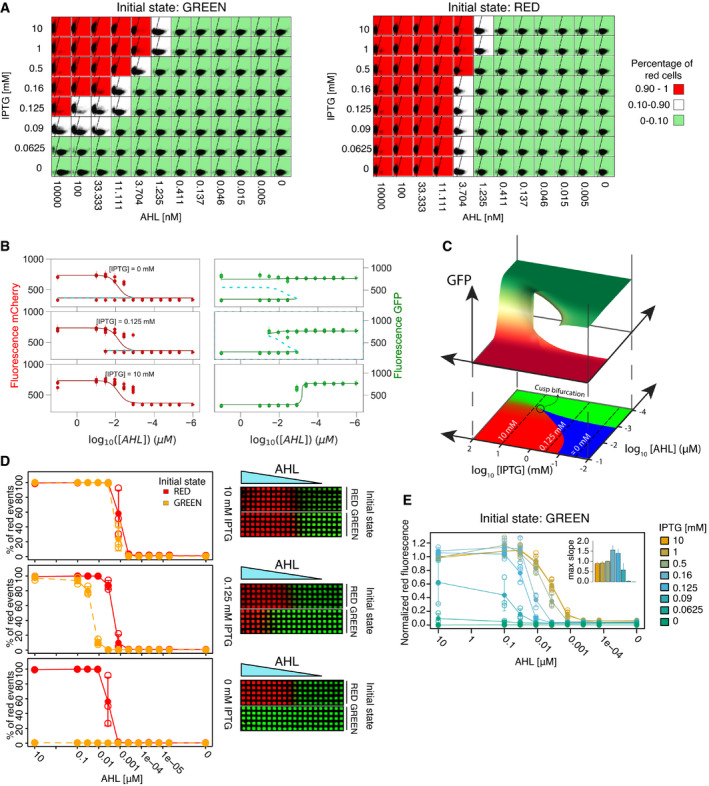
Figure 2. Controlling the hysteresis, position, and sharpness of the boundary.

- Quantitative single‐cell analysis of the inducible toggle switch. Overview of the flow cytometry data of a representative replicate. Each square shows red (y‐axis) and green (x‐axis) fluorescence of the population (10,000 events) measured at indicated concentrations of IPTG and AHL after 10 h of incubation. Background color corresponds to the percentage of red gated events as indicated.
- Comparison between the observed populated states from the flow cytometry data (circles) and the available steady states predicted by the model (solid lines: stable states; dashed lines: unstable states), shown for three IPTG concentrations. The median and the standard deviation of the experimentally observed states of the gated populations from three replicates are shown. Parameters used in the model are the best parameter candidates from the MCMC fitting (Table 1). The whole dataset is shown in Fig EV3.
- Top: Bifurcation diagram for the parameters found in the fitting, showing the stable steady states available for different combinations of [AHL] and [IPTG]. Bottom: phase portrait of the TS, indicating monostable regions in red/green proportionally to the concentrations of mCherry/GFP and bistable conditions in blue. The circle indicates the cusp bifurcation.
- Effect of initial conditions in the patterning of the TS showing the hysteresis at three different IPTG concentrations, corresponding to the three different regimes showed in (C) as dashed lines. Left: Mean percentage of red cells (full circles) for different concentrations of AHL are shown for an initial population in the red state (solid red lines) and for an initial population in the green state (dashed orange lines). Error bars show standard deviation of three biological replicates (individually shown as empty circles). Right: Grid patterns at constant IPTG concentrations. Five microliter of a solution of 100 μM AHL was added at the left to create the gradient. Colors correspond to the intensity of red and green fluorescence.
- Sharpness of the boundary. Normalized red fluorescence for an initial population in the green state in an AHL gradient at different IPTG concentrations. Mean (full circles) and standard deviation (error bars) of three biological replicates (individually shown as empty circles). The inset bar plots represent the mean of the maximum slope of each curve from three replicates with standard deviation as error bars (Appendix Fig S1).
Source data are available online for this figure.
