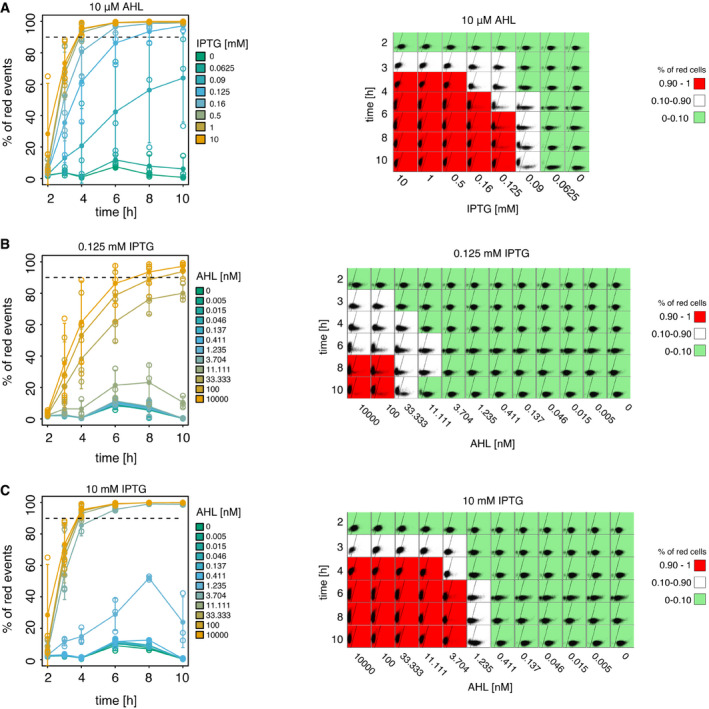
Figure 3. Temporal dynamics of patterning with the inducible toggle switch.

-
A–CEffect of IPTG and AHL concentrations on the switching time from the green to the red state. For plots in the right column, each square represents flow cytometry data of 10,000 events measuring red (y‐axis) and green fluorescence (x‐axis). Background color of each square indicates whether > 90% of the events are in the red or the green gate. Plots in the left column show the percentage of cells in the red gate over time. Shown are the mean (full circles) and standard deviation (error bars) of three biological replicates (individually shown as empty circles). (The data at time point 8 h for 1 and 10 mM IPTG are based on two replicates due to failed flow cytometry measurements.) Dashed lines indicate the 90% threshold used to color the flow cytometry plots. (A) Analysis of state transition over time in the presence of different IPTG concentrations and a high level of AHL (10 μM). (B, C) Analysis of state transition over time in the presence of different AHL concentrations and two different IPTG concentrations corresponding to the bistable (0.125 mM) and sigmoidal (10 mM) regimes.
Source data are available online for this figure.
