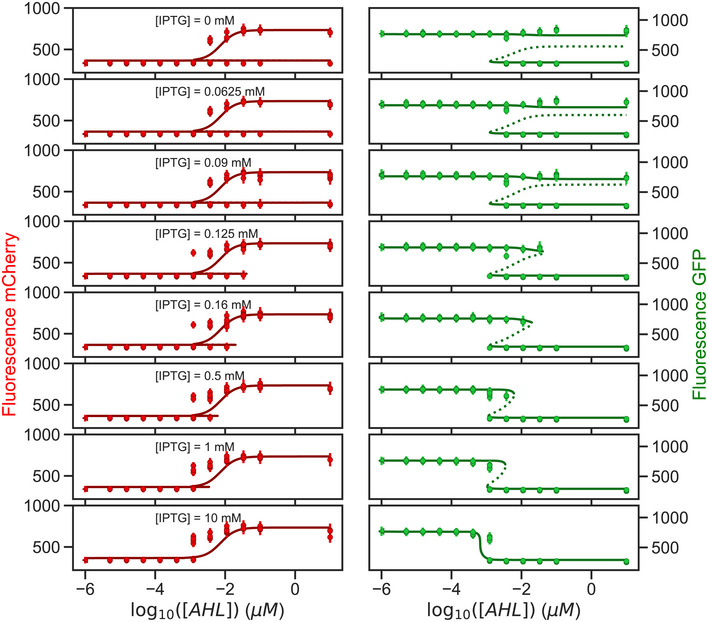
Figure EV3. Parameterization of the mathematical model.

Complete dataset of Fig 2B. Comparison between the observed populated states from the whole flow cytometry dataset (circles) and the available steady states predicted by the model (solid lines: stable states; dotted lines: unstable states). Experimentally observed states show the median and standard deviation for the different gated populations from three replicates. Parameters used in the model are the best parameter candidates from the MCMC fitting.
