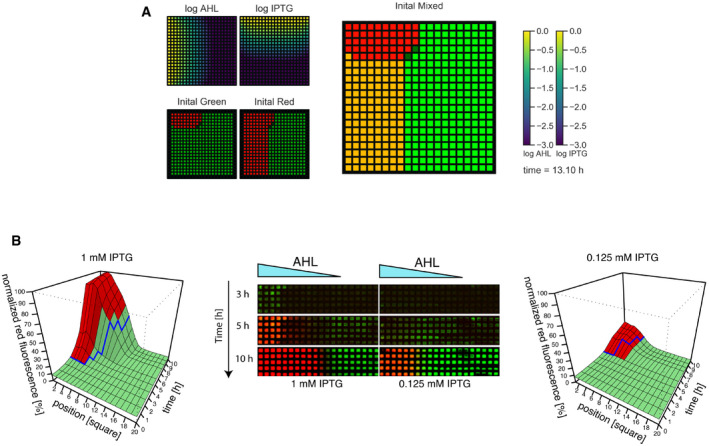
Figure 4. Patterning in the sigmoidal regime is faster than that in the bistable regime.

- Modeling of the pattern observed in the grid assay (Fig 1C–E). Results show the state of the system at 13.10 h posterior to gradient initiation for both diffusive molecules (top left panels) and the response of the network for different initial conditions (bottom left panels and right panel). Gene expression is color‐coded shown in green for GFP/LacI expression and in red for mCherry/TetR expression. Positions where different cellular states are obtained depending on the initial condition chosen are indicated in yellow.
- Time course of pattern formation in the grid in the sigmoidal (1 mM IPTG, left) and bistable (0.125 mM, right) regimes. Center: Before growing on the grid, bacteria were turned into the green state. The indicated concentration of IPTG was homogeneously present in the agar plate, and 5 μl of 100 μM AHL was loaded at the left edge of the grid. The grids were incubated at 37°C and imaged at the indicated times. A representative replicate is shown. Left and right 3D plots represent the quantitative analysis of mean red fluorescence intensity in the grid over time and position of three biological replicates. Blue lines represent the boundary predictions from the mathematical model. Green and red colors correspond to measurements where the red fluorescence intensity is below or above 50% of the highest intensity measured along the AHL gradient at each time point, respectively, corresponding to how the boundary was defined in silico (see Materials and Methods for details).
Source data are available online for this figure.
