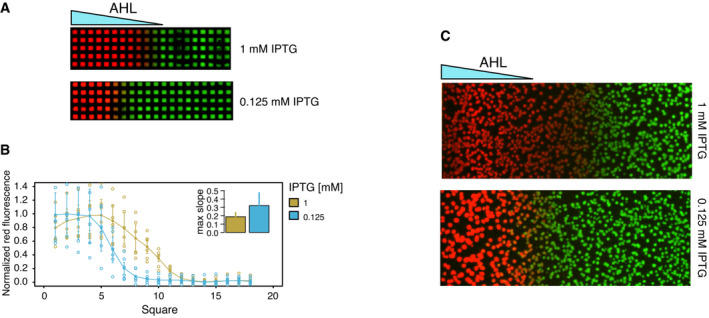
Figure EV4. Boundary precision when bacteria are growing on a solid surface.

- Grid assay at two different homogenous concentrations of IPTG, 1 mM for the sigmoidal regime and 0.125 mM for the bistable regime. Five microliter of a solution of 100 μM AHL was added at the left.
- Quantification of red intensity of six biological replicates, of which one representative replicate is shown in A. Shown are the mean (full circles) and standard deviation (error bars) of six biological replicates (individually shown as empty circles). The inset bar plot shows the mean of the maximum slope measured for each IPTG concentration from six replicates with standard deviation as error bars.
- Pictures of bacterial colonies harboring the inducible TS in the presence of homogenous IPTG concentrations (top: 1 mM; bottom: 0.125 mM) and in a gradient of AHL. To generate the gradient, 10 μl of 100 μM AHL was added on a paper disk placed on the left edge (not shown). Pictures were taken after overnight incubation (˜ 16 h) at 37°C.
