
Figure 5. A homogeneous pulse of IPTG allows to control the pattern formation.
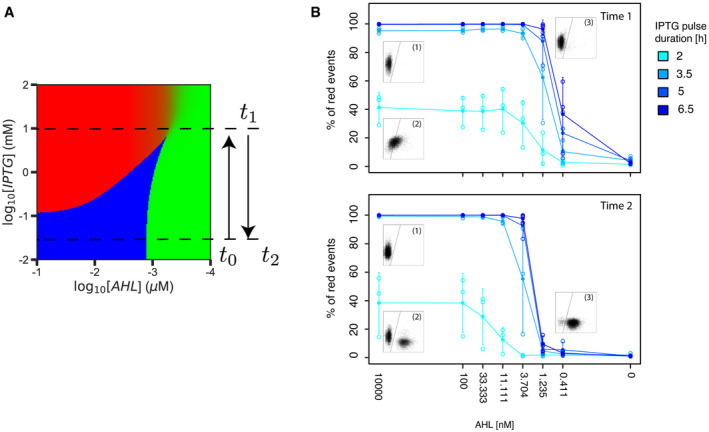
- Schematic of the protocol used. Cells initially in the green state for low levels of IPTG (irreversible bistable regime) are exposed to a pulse of high IPTG (at time t 0) bringing the system to the sigmoidal region where a gradient of AHL can induce a pattern. Removing IPTG (at time t 1) takes the system back to the bistable zone, thus freezing the boundary and making it robust to changes in AHL (at any posterior time t 2).
- Response of the system to IPTG pulses of different durations (2–6.5 h) at different AHL concentrations. Cells were grown in the presence of 10 mM IPTG and the indicated amount of AHL and analyzed by flow cytometry. Shown are the mean (full circles) and standard deviation (error bars) of three biological replicates (individually shown as empty circles). The top graph displays the percentages of red cells observed just after the incubation with IPTG (time 1, t 1). Next, the cells were diluted and grown for another 6 h without IPTG, but with the same concentration of AHL as during the IPTG pulse. The bottom graph displays the percentage of red cells observed after this incubation (time 2, t 2). Inset graphs represent red (y‐axis) and green (x‐axis) fluorescence measured by flow cytometry (10,000 events). The following conditions are shown: (i) 6.5 h pulse, 10,000 nM AHL; (ii) 2 h pulse, 10,000 nM AHL; and (iii) 6.5 h pulse, 1.235 nM AHL.
Source data are available online for this figure.