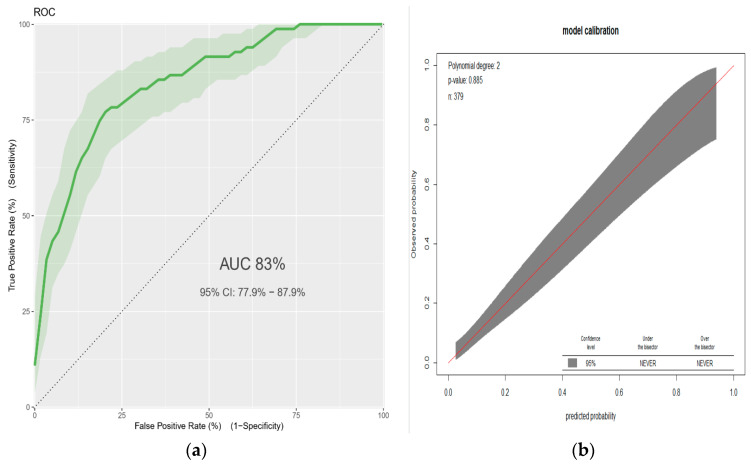
Figure 1.
(a) Area under the ROC curve for the prediction model, and (b) predicted versus observed low birthweight probability in the sample. This analysis includes neonates born at term (n = 379). The calibration plot created using “givitiCalibrationBelt” in R programming. Linear predictors for estimated risk of low birthweight = 1/(1 + exp − (−2.54 + 1.593 × age(<20) + 1.516 × BMI (<18.5) + 1.213 × hemoglobin (<11) + 1.225 * height (<155) + 0.606 × prim-gravid + 1.475 × comorbidity. ROC = receiver operating characteristic.

