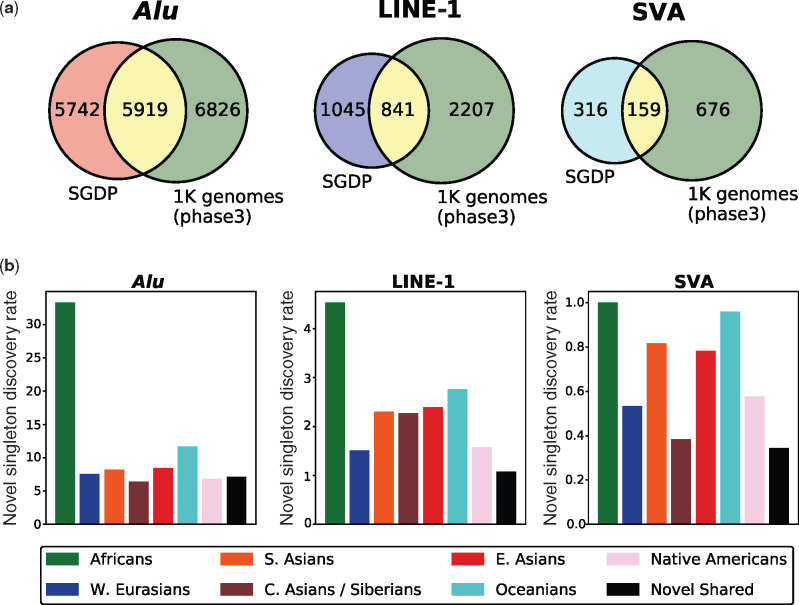
Fig. 1.
—Comparison of the SGDP MEI loci to the 1000 Genomes Project (phase 3) MEI loci. (a) Venn diagrams show the intersection of nonreference MEIs discovered in the SGDP (296 individuals) and the 1000 Genomes Project (phase 3) data sets (2,504 individuals). The per sample MEI discovery rates were ∼4- to 7-fold higher in the SGDP than the 1000 genomes collection. Discovery rates were highest for the nonreference Alu insertions. A window of ±25 bp was used to determine positional overlap between the data sets. (b) A bar plot shows the normalized rate of novel singleton MEIs discovery per individual in the SGDP for each major population group. Alu singleton insertions were discovered at a higher rate than LINE-1 or SVA singleton insertions. Africans consistently had the highest rate of discovery. The black bar shows the discovery rate of novel nonsingleton MEIs. Rates are calculated as the number of novel MEIs counts divided by the number of individuals in the population (Africans: 49, West Eurasians: 75, South Asians: 49, Central Asians and Siberians: 26, East Asians: 46, Oceanians: 25, Native Americans: 26, and all populations: 296).

