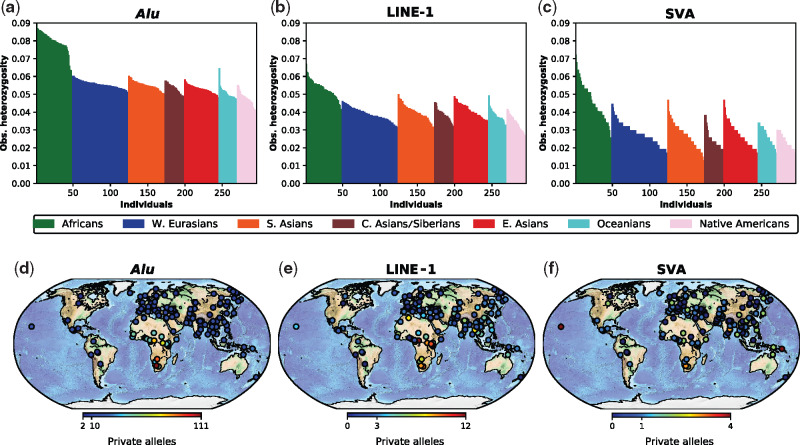
Fig. 3.
—Geographic structure of MEI heterozygosity and private alleles. (a–c) Individual MEI heterozygosity for Alu, LINE-1, and SVA elements are shown. Each bar represents one individual, and the height of the bar shows the observed fraction of heterozygous sites found in that sample. Samples are sorted from high to low within each of the seven major population groups. (d–f) Heat maps show the geographic location and number of private insertions for all individuals for each MEI type. (a–f) A trend of decreasing heterozygosity and decreasing private alleles with increasing distance from Africa occurs for all retrotransposon types.

