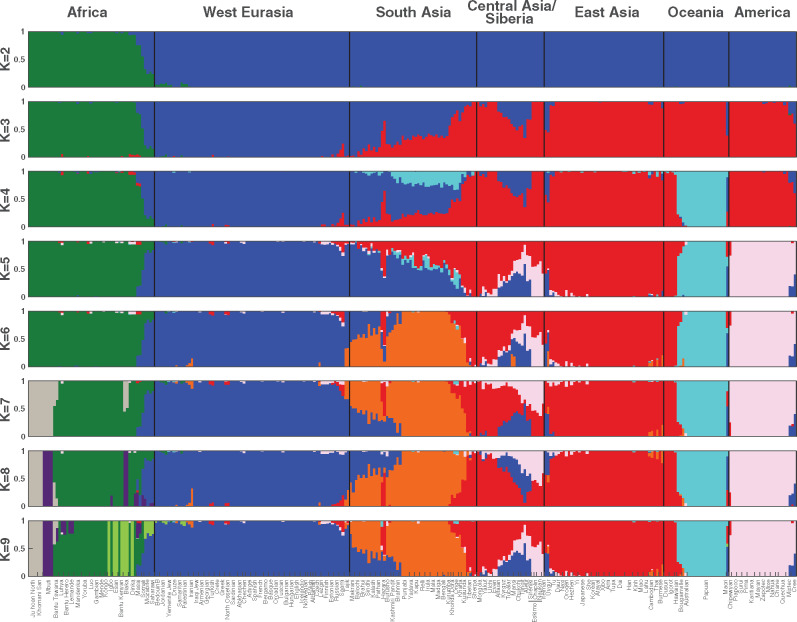
Fig. 4.
—MEI-based estimates of admixture among the SGDP populations. Admixture among the 142 populations was modeled using two to nine predicted ancestral populations and all polymorphic autosomal MEIs. K represents the number ancestral groups in the given model. Each individual is plotted as a stacked colored bar on the x axis, and each color in the bar shows the proportion of admixture for each of the K ancestral groups in that model. Individuals are also grouped by major geographic region. Populations bordering transitions between Africa and West Eurasia, South Asia and West Eurasia, and East Asia and South Asia are substantially admixed. Many Central Asian and Siberian populations demonstrate tri-partite shared ancestry consisting of Asian, European, and New World components.

