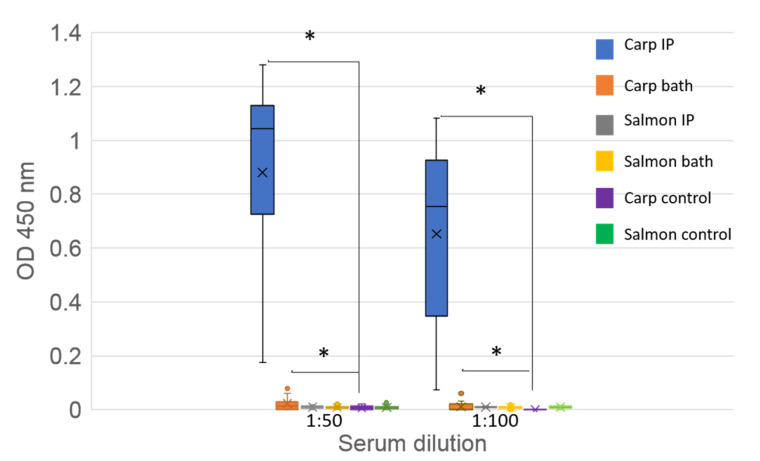
Figure 7.
ELISA detection of CSBV antibodies in serum from challenged common carp and Atlantic salmon. Sera tested at 1:50 and 1:100 dilutions. Each bar represents from each group the median (cross), upper and lower quartile (box) and upper and lower extreme (line) of the optical density (OD) at 450 nm. Single points indicate outliers. Sample number per group: 15. IP: intraperitoneally injected fish; bath: bath infected fish. Asterisks (*) denotes significant differences (p < 0.5) between the treated and control groups.

