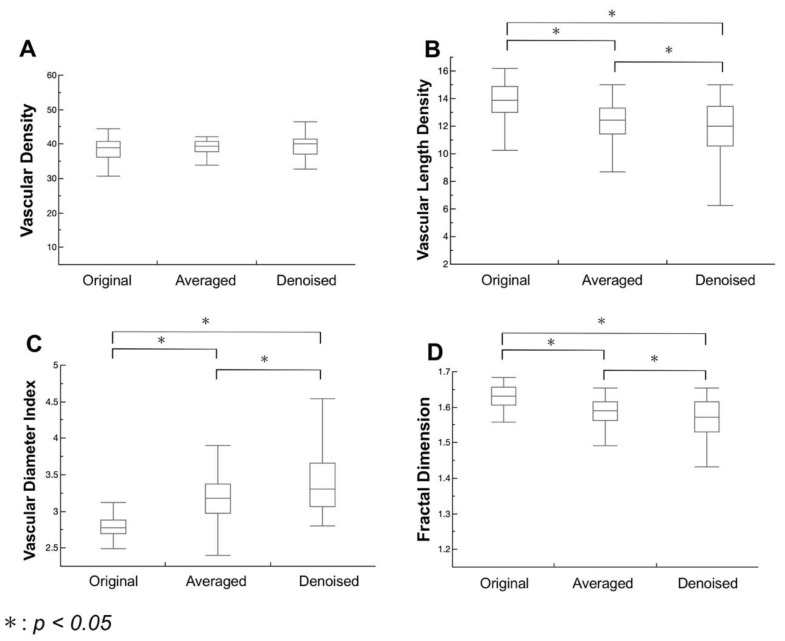
Figure 3.
Quantitative analysis of microvascular density and morphology in optical coherence tomography angiography (OCTA) images. Box-whisker plots showing the values of (A) vascular density (VD), (B) vascular length density (VLD), (C) vascular diameter index (VDI), (D) and fractal dimension (FD). The horizontal lines represent the maximum (top line), third quartile (top of the box), median (line in the middle of the box), first quartile (bottom of the box), and minimum (bottom line). There are statistically significant differences in VLD, VDI, and FD among the original, averaged, and denoised images. Meanwhile, we found no significant difference in VD among the three images. We utilized P < 0.05 in the Tukey–Kramer test.

