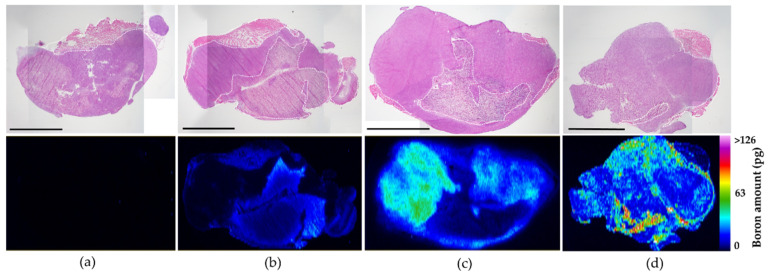
Figure 7.
In vivo fluorescence imaging of 10B distribution of 10B-MMT1242 in tumor tissues. An in vivo 10B distribution study showing slightly heterogeneous but broad range of 10B distribution in tumor tissues after 10B-MMT1242 administration (d) compared to control (a), 10B-BSH (b), and 10B-BPA (c). Each black scale bar stands for 5mm. Each white dotted line in the figures represents interstitial spaces in the tumor tissues.

