Figure 1.
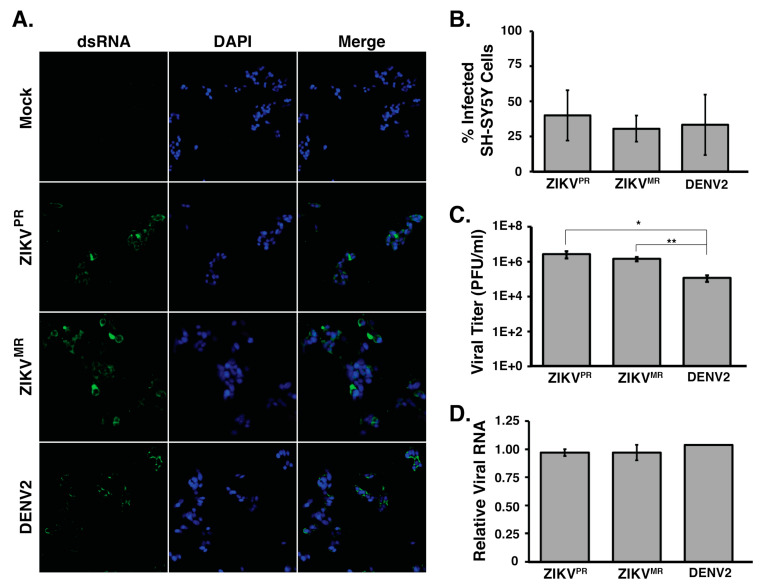
SH-SY5Y cells are infected by ZIKV and DENV2. (A) Immunofluorescence images of virus-infected SH-SY5Y cells. SH-SY5Y cells seeded in 48-well plates were infected at a moi of 5 and fixed 24 h post infection. Virus-infected cells were visualized using an antibody that detects the replication intermediate dsRNA, and all cells in the field of view were visualized by staining cell nuclei with Hoechst and at 10× magnification. (B) Quantification of the percentage of infected cells. Uninfected and virus-infected SH-SY5Y cells seeded in 48-well plates were fixed and stained for dsRNA and Hoechst. A 2F0× objective was used to image three sections per well per virus where more than 400 cells for each independent infection were counted. The percentages of infected cells were determined. At least three biological replicates were performed. (C) Titers of virus released into the medium from ZIKV and DENV2-infected SH-SY5Y cells were determined by plaque assays. (D) RT-qPCR analysis of SH-SY5Y cells infected at a moi of 5. Primers targeting the coding regions of each virus were used along with primers for β-actin mRNA. Relative viral RNA levels were calculated by standardizing relative fluorescent units at Ct for each virus against β-actin mRNA. Error bars represent standard deviations established from three independent infections. No significant difference was determined for the number of cells counted in panel 1B, or the relative abundance of viral RNA in panel 1D. For statistical analysis, two-tailed student T-tests were performed (* p < 0.05; ** p < 0.01).

