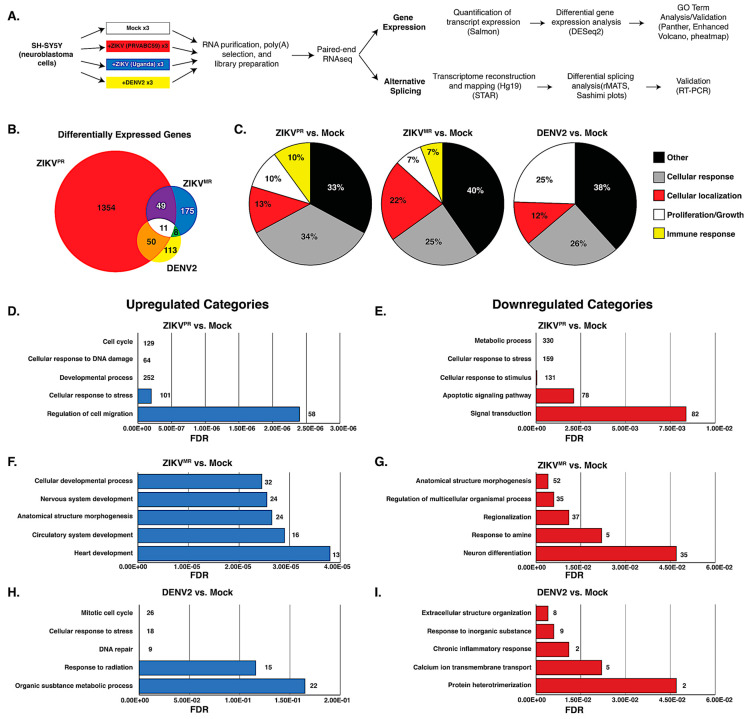
Figure 2.
Transcriptome analysis of mock- and virus-infected SH-SY5Y cells. (A) Schematic showing the pipeline from cells to differential gene expression and alternative splicing analysis. (B) Venn diagram of differentially expressed (DE) transcripts between cells infected with different viruses versus mock-infected SH-SY5Y cells. DE transcripts from ZIKVPR versus mock, ZIKVMR versus mock, and DENV2 versus mock are highlighted in the red, yellow, and blue circles, respectively. (C) All differentially expressed genes for each condition were input into ShinyGO(2.0), and the top 25 biological GO terms were categorized into five types, with the distribution of each type presented in a pie chart. (D,F,H) Top five functional categories derived from statistically significant upregulated genes for the indicated condition. (E,G,I) Top five functional categories derived from statistically significant downregulated genes for the indicated condition. GO terms are annotated on the y-axes, and false discovery rates (FDR) are represented on the x-axes.

