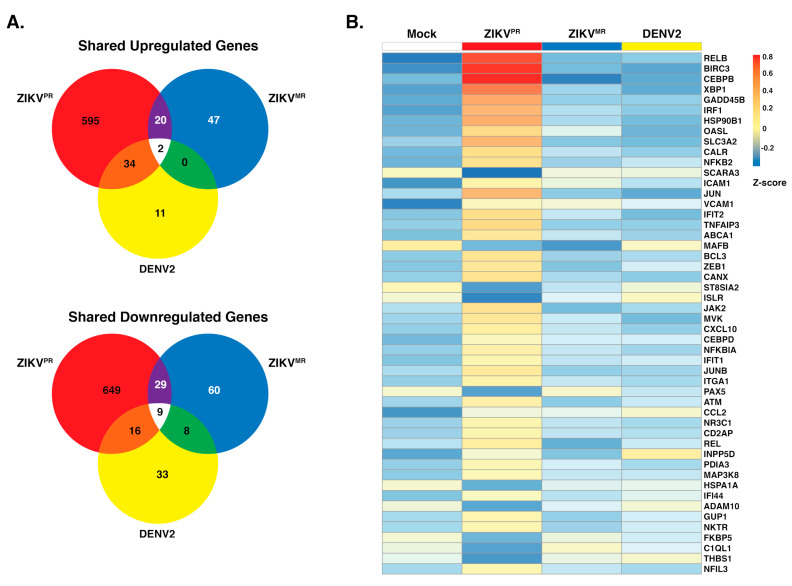
Figure 3.
Upregulation and downregulation of genes in SH-SY5Y cells infected with ZIKVPR, ZIKVMR, and DENV2. (A) Venn diagram of genes differentially expressed between infected SH-SY5Y cells that were differentially upregulated (top) or downregulated (bottom). DE transcripts from ZIKVPR, ZIKVMR, and DENV2 are within the respective red, blue, and yellow circles. (B) Heatmap of the top 50 statistically significant differentially expressed immune response genes in ZIKVPR-infected cells compared to mock. The expression of these genes in ZIKVMR and DENV2-infected SH-SY5Y cells is shown for comparison. Three replicates from each condition were collapsed and normalized to mock. The color scale shows the Z-score of the immune response genes.

