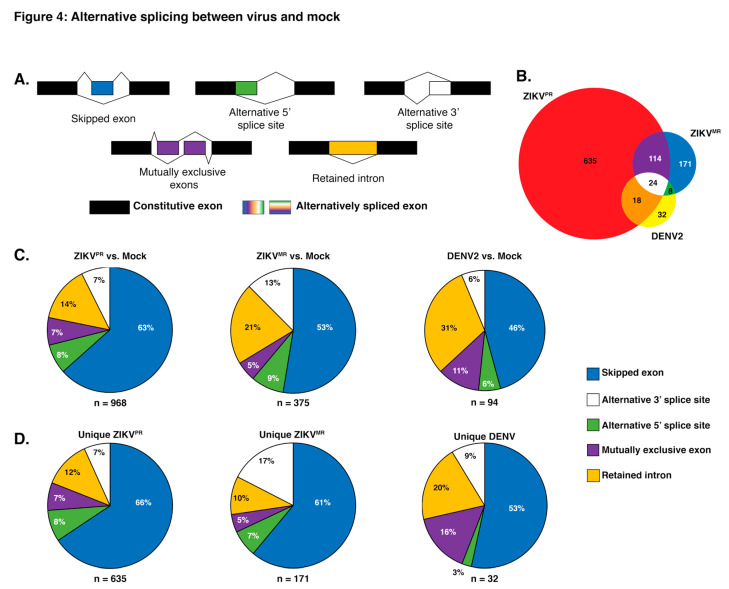
Figure 4.
Analysis of alternative splicing events in virus versus mock-infected SH-SY5Y cells. (A) Schematic illustrating the five alternative splice events characterized in our analyses. The unchanged exons are black, while the differentially spliced exons are color coded. (B) Venn diagram of shared and unique genes that were alternatively spliced between virus and mock-infected cells. Alternative slicing (AS) events from ZIKVPR versus mock, ZIKVMR versus mock, and DENV2 versus mock are highlighted in the red, blue, and yellow circles respectively. (C) Pie charts depicting the percentages of all unique AS events for the three viruses versus mock-infected SH-SY5Y cells. (D) Pie charts representing the percentages of each type of AS event unique to each virus infection in SH-SY5Y cells. The segment colors match the AS events illustrated in (A). Values in (B) account for unique genes while (C) represents all unique splicing events.

