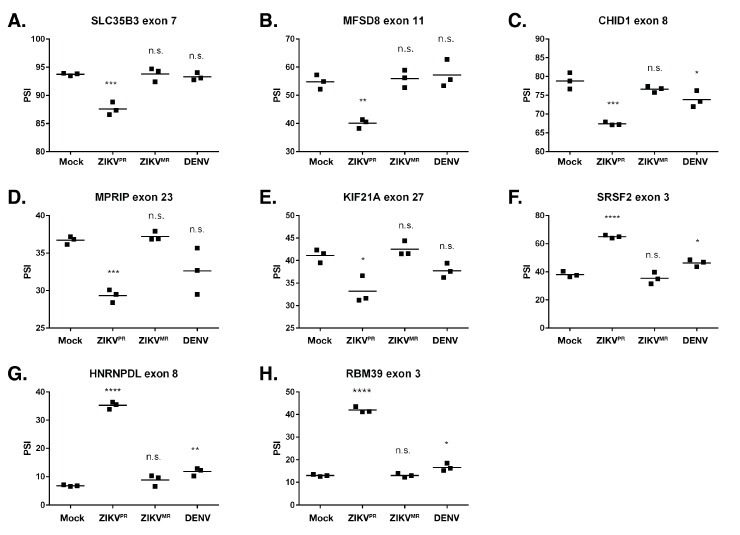
Figure 5.
Validation of select alternative splicing events in mock-, ZIKVPR-, ZIKVMR-, and DENV2-infected SH-SY5Y cells. (A–H) RNA from each of the three biological replicates was used for RT-PCR for the indicated gene. The percent spliced in (PSI) was calculated as described in the Materials and Methods. PSI indicates the change in the inclusion of a regulated exon. The significance of the data was determined from three independent experiments using the GraphPad software and performing an unpaired Student’s t-test; n.s. denotes not significant, * p < 0.05, ** p < 0.01, *** p < 0.001, and **** p < 0.0001. Figure S6 shows the corresponding schematics of the gene exons examined as well as the RT-PCR products and Sashimi plots for the genes analyzed in this figure. Figure S7 shows the correlation between the PSI values obtained from RNA-seq and RT-PCR.

