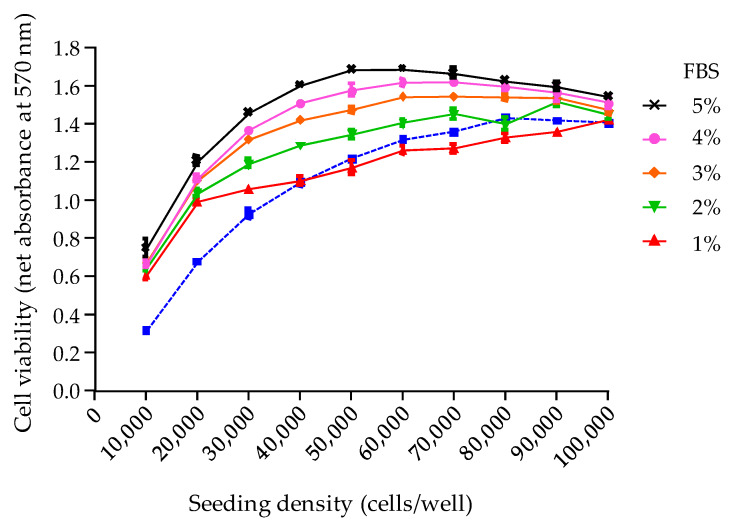
Figure 3.
Final viability of N2a cells observed at different seeding densities when cultured 26 h in 5% FBS culture medium followed by 19 h in fresh growth medium supplemented with 1% FBS (red), 2% FBS (green), 3% FBS (orange), 4% FBS (pink) and 5% FBS (black). The initial viability measured in the Reference Cell Viability (RCV) control microplate after 26 h of growth is represented by the blue dotted curve. Data represent the mean ± SD of one microplate (N2a cells at 537 P), each point tested in six wells. Absorbance values were measured at 570 nm via the MTT assay, after a 45 min MTT incubation time.

