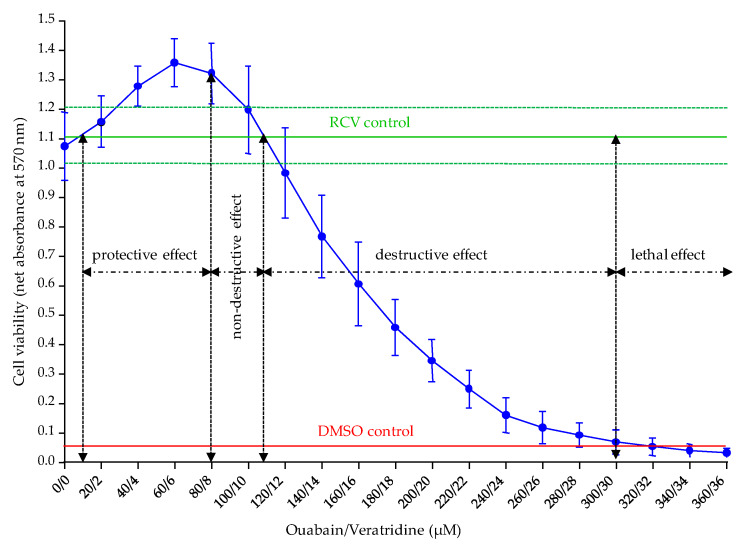
Figure 4.
Dose-response curve of N2a cells when exposed to increasing concentrations of Ouabain and Veratridine (O/V) treatments ranging from 0/0 to 360/36 µM. Data represent the mean ± SD of one microplate in six independent experiments corresponding to cell passage numbers of 384, 542, 800, 801, 803 and 804 P, each point run in triplicate. The mean absorbance ± SD values corresponding to the RCV control (horizontal green line and dotted green lines) and DMSO control (horizontal red line) were determined at 1.105 ± 0.096 and 0.042 ± 0.001, respectively. Absorbance values were measured at 570 nm via the MTT assay, after a 45 min MTT incubation time. The four different effects induced by increasing concentrations of O/V treatment on N2a cells, i.e., protective, non-destructive, destructive and lethal are also represented.

