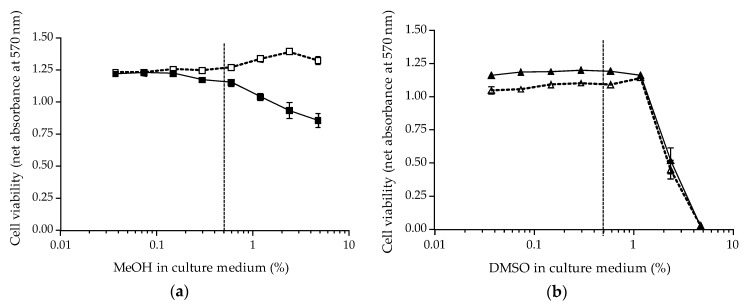
Figure 5.
Dose-response curves of N2a cells when exposed to increasing concentrations of two solvents, in OV− (open symbols) and OV+ (solid symbols) conditions at 100/10 µM (final concentrations); (a) MeOH (□/■) and (b) DMSO (∆/▲) were tested using N2a cells at 551 and 549 P, respectively. Data represent the mean ± SD of one microplate, with each point run in triplicate. Absorbance values were measured at 570 nm via the MTT assay, after a 45 min MTT incubation time. The initial cell viability in the RCV control was 1.139 ± 0.021 and 0.995 ± 0.031 and the final cell viability in the absence of O/V treatment (COV−) control was 1.217 ± 0.025 and 1.047 ± 0.023 for (a,b), respectively. The dotted vertical line corresponds to the maximum solvent concentration 0.5% for solvent interferences.

