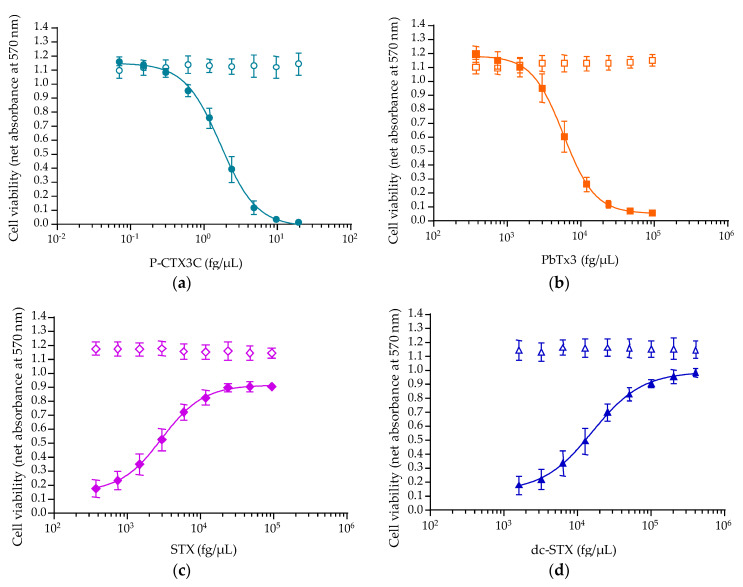
Figure 7.
Dose-response curves displayed by N2a cells when exposed to nine increasing concentrations of toxin standards after 19 h exposure time, in OV− (open symbols) and OV+ (solid symbols) conditions at 100/10 µM for voltage gated sodium channels (VGSC) activators and 270/27 µM for VGSC inhibitors (plain symbols): (a) P-CTX3C (○/●); (b) PbTx3 (□/■); (c) (STX) (◊/♦); (d) dc-STX (∆/▲). Data represent the mean ± SD of one microplate in three independent experiments (N2a cells at 662, 663 and 666 P), with each concentration run in triplicate. Net absorbance values were 1.101 ± 0.067 and 1.077 ± 0.058 in COV− controls (n = 3), and 1.209 ± 0.014 and 1.226 ± 0.055 in COV+ controls (n = 3) for (a,b), respectively, for VGSC activators. Net absorbance values were 1.170 ± 0.046 and 1.113 ± 0.067 in COV− controls (n = 3), and 0.136 ± 0.051 and 0.145 ± 0.060 in COV+ controls (n = 3) for (c,d), respectively.

