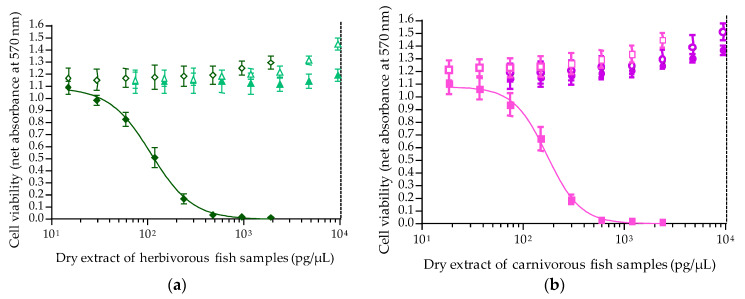
Figure 8.
Dose-response curves displayed by N2a cells when exposed to increasing concentrations of fish dry extracts (LF90/10) of two herbivorous fishes (a) and two carnivorous fishes (b) after 19 h exposure time in OV− (open symbols) and OV+ conditions 85.7/8.57 µM (solid symbols): Cmic02 (∆/▲), Cmic19 (◊/♦), Emer13 (○/●) and Emer05 (□/■). Data represent the mean ± SD of one microplate in three independent experiments (N2a cells at 795, 797 and 798 P), with each concentration run in triplicate. The dotted vertical line corresponds to the maximum concentration of dry extract (MCE = 10,000 pg/µL) for matrix interferences.

