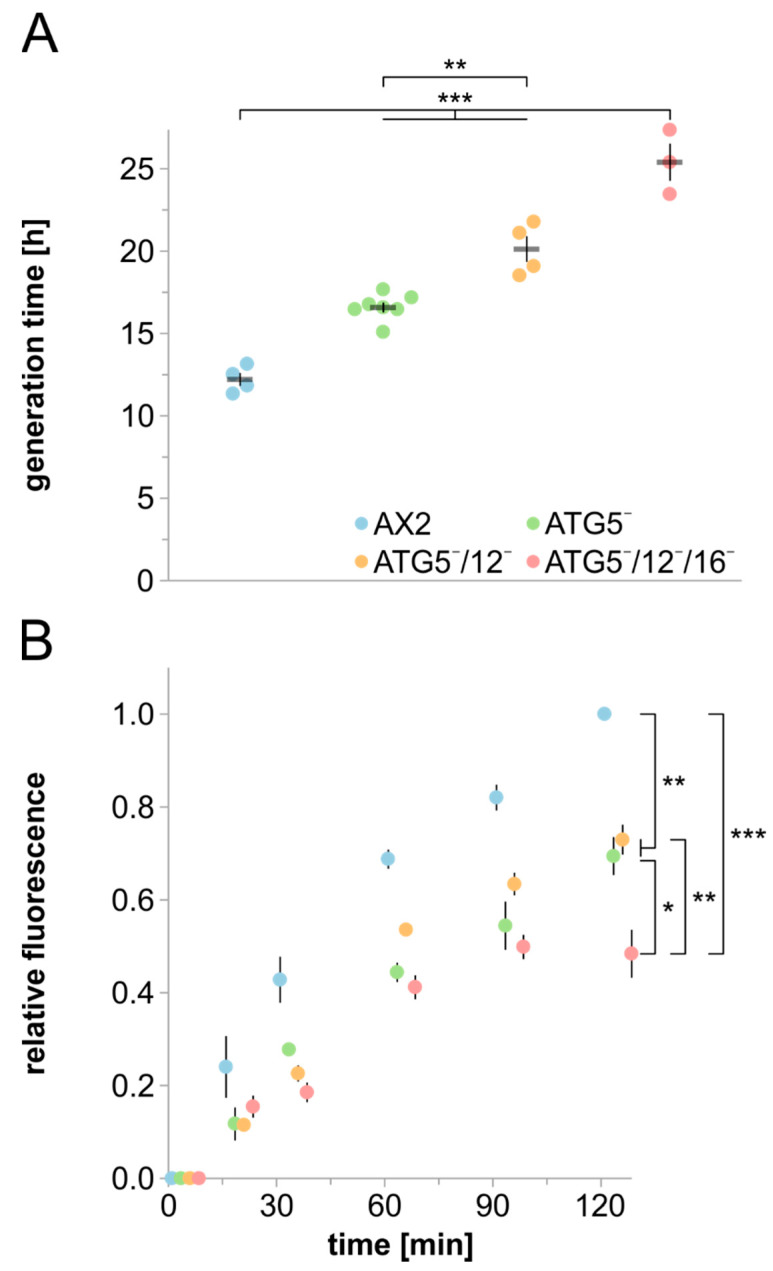
Figure 5.
Analysis of cell growth and macropinocytosis in AX2 and mutant strains. (A) Generation time of AX2, ATG5¯, ATG5¯/12¯ and ATG5¯/12¯/16¯ cells in shaking culture. Cell titres of three parallel shaking cultures were determined every 24 h. Mean values and SEM of three (ATG5¯/12¯/16¯), four (AX2 and ATG5¯/12¯) and seven (ATG5¯) independent experiments are shown. For statistical analysis, one-way ANOVA and Tukey’s test as post hoc analysis were used. (B) Macropinocytosis of TRITC-labelled dextran. AX2, ATG5¯, ATG5¯/12¯ and ATG5¯/12¯/16¯ cells were adjusted to 6 × 10⁶ cells/mL and co-incubated with TRITC-labelled dextran. Intracellular fluorescence was determined at t0 and after 15, 30, 60, 90, and 120 min. The final fluorescence of AX2 was set to 1. Color assignment of strains is as in panel A. Mean values and SEM of three independent experiments are shown. For statistical analysis, two-way ANOVA and Tukey’s test as post hoc analysis were used. *, significant (p-value < 0.05); **, very significant (p-value < 0.01); ***, highly significant (p-value < 0.001).

