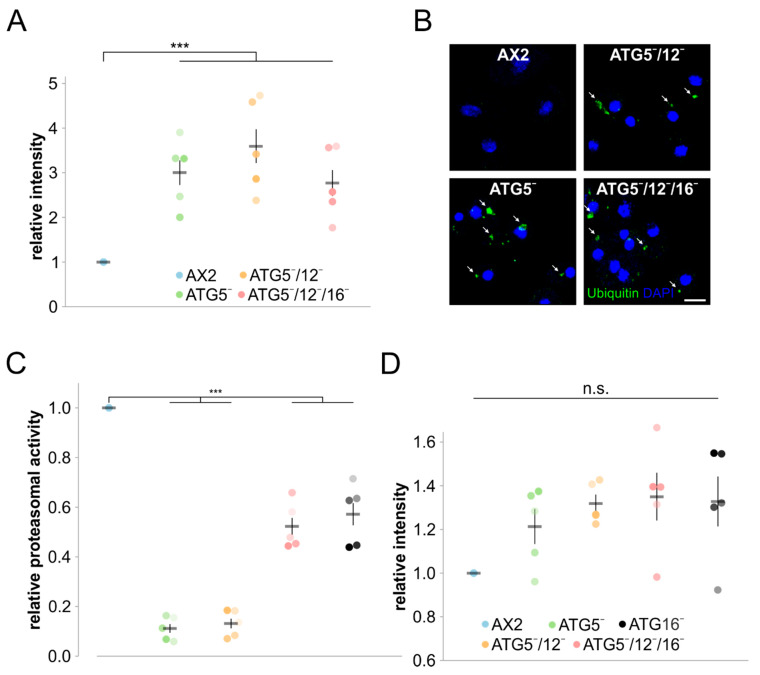
Figure 7.
Protein homeostasis is disturbed. (A) Quantification of global protein ubiquitination of AX2, ATG5¯, ATG5¯/12¯, and ATG5¯/12¯/16¯ cells. Western blots of total cell lysates were stained with mAb P4D1 and signal intensities of ubiquitinated proteins were quantitated and normalised with the actin signal. The signal intensity of AX2 was set to 1. Mean values and SEM of five independent experiments are shown. (B) Immunofluorescence microscopy of AX2, ATG5¯, ATG5¯/12¯, and ATG5¯/12¯/16¯ cells. Cells were fixed with cold methanol and stained with the mAb P4D1. Ubiquitin-positive protein aggregates in mutant strains are marked by arrows. Nuclei were visualised by DAPI staining. Scale bar, 5 µm. (C) Proteasomal activity of AX2, ATG5¯, ATG5¯/12¯, ATG5¯/12¯/16¯, and ATG16¯ cells. The assay was performed as described [39]. The chymotrypsin-like activity of AX2 was set to 1. Color assignment of strains is as in panel D. Mean values and SEM of five independent experiments are shown. (D) Quantification of the amount of the proteasomal subunit A7 (psmA7) in AX2, ATG5¯, ATG5¯/12¯, ATG5¯/12¯/16¯, and ATG16¯ cells. The psmA7 signal intensities were quantitated after Western blotting and normalised with the actin signal. The signal intensity of AX2 was set to 1. Mean values and SEM of five independent experiments are shown. For all statistical analyses, two-way ANOVA and Tukey’s test were used as post hoc analysis. n.s., not significant; ***, highly significant (p-value < 0.001).

