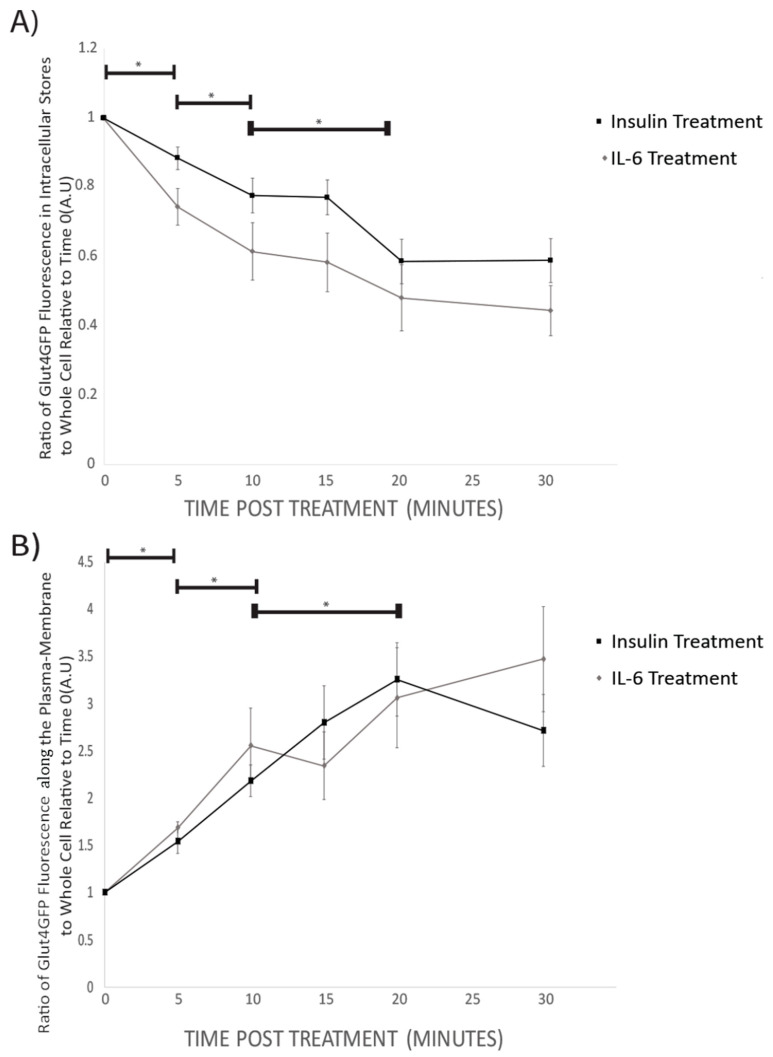
Figure 4.
GLUT4-GFP Fluorescent Localization Quantification Following IL-6 and Insulin Treatment in Differentiated SH-SY5Y Cells: SH-SY5Y cells were treated with 100nM of insulin, and 20ng/mL of IL-6 for 5, 10, 15, 20, and 30 min. (A) Ratio of intracellular store to whole-cell fluorescence of GLUT4-GFP Decreases with time both in IL-6 (n = 12) and insulin (n = 9) treated cells. (B) The ratio of GLUT4GFP along the plasma-membrane to whole cell fluorescence increases with time in both IL-6 (n = 12) and insulin (n = 9) treated cells. Data are presented as means ± SE. A.U., arbitrary units. * p < 0.05 as determined using a Mann-Whitney U test between each time point.

