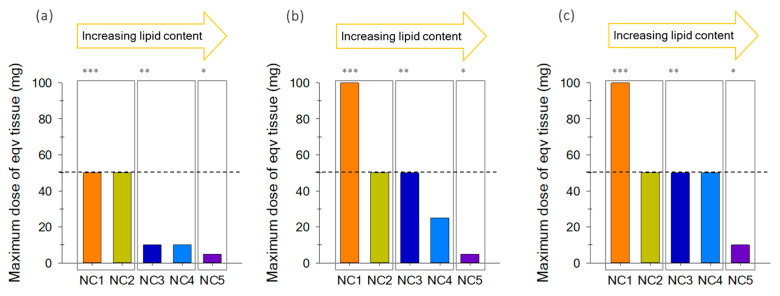
Figure 3.
Graph bars shows MTDE for each species, framing * fat fish; ** semi-fat fish; *** low-fat fish. Results were obtained after 16 h exposure to CTX-negative fish extracts obtained by (a) Extraction procedure without cleanup step (b) SPE Florisil and (c) SPE Florisil + SPE-C18 step: Pagrus pagrus (orange); Epinephelus marginatus (yellow); Pomatomus saltatrix (dark blue); Seriola dumerili (blue) and Acantocybium solandri (purple). Dotted line represents a dose of 50 mg TE.

