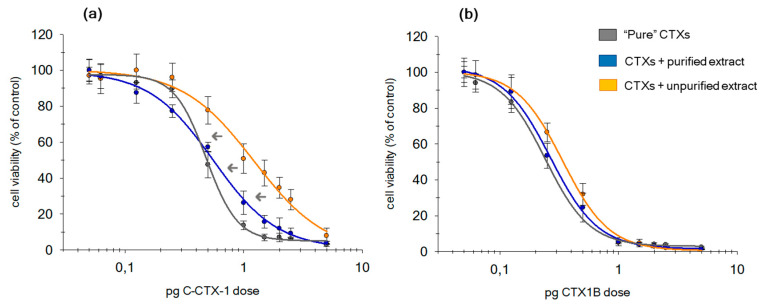
Figure 4.
Dose-response curves of N2a cells in +OV conditions (cells with ouabain and veratridine treatment), exposed to an increasing dose of: (a) C-CTX1 and (b) CTX1B when 20 mg of fish TE, unpurified (orange curves) and purified (blue curves), was added to each well. Gray curves represent response of cells to both CTXs without matrix.

