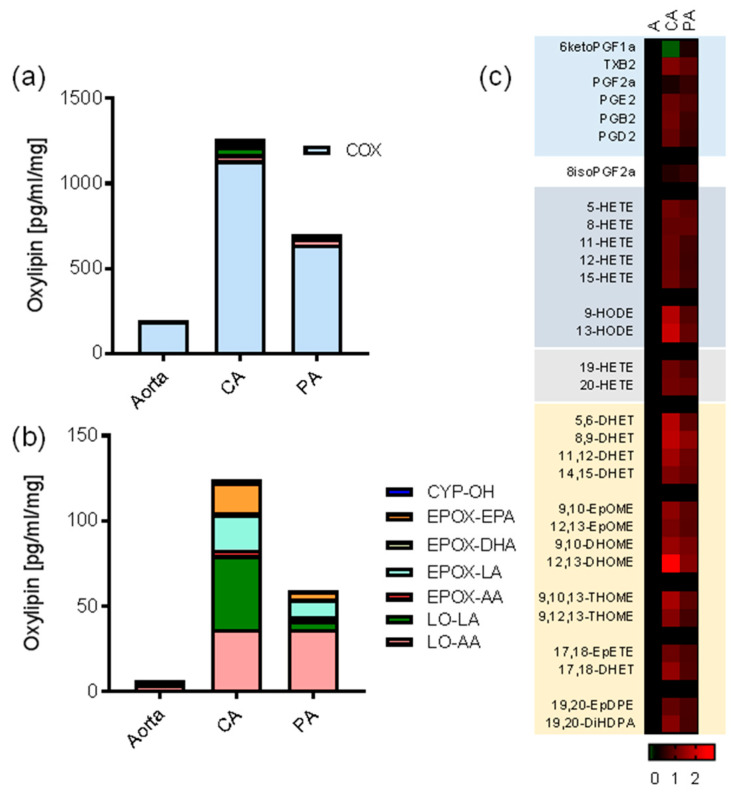
Figure 1.
Characterization of oxylipin production from aorta, coronary artery, and pulmonary artery. (a,b) Comparative and relative contribution of cyclooxygenase (COX), lipoxygenase-arachidonic acid (LO-AA), lipoxygenase-linoleic acid (LO-LA), CYP-epoxygenase-arachidonic acid (EPOX-AA), CYP-epoxygenase-linoleic acid (EPOX-LA), CYP-epoxygenase-DHA (EPOX-DHA), CYP-epoxygenase-EPA (EPOX-EPA), and CYP-ω-hydroxylase (CYP-OH) products to the oxylipin releasate of aorta, coronary artery (CA), and pulmonary artery (PA) in 24 h organ culture. (a) shows all pathways, whereas (b) shows all pathways minus COX. Bars are based upon the single most oxylipin abundant oxylipin product detected in each pathway which is used as a representative index of oxylipin class. (c) Heatmap showing Log10 fold differences in the mean amount of each oxylipin detected from coronary artery (CA) and pulmonary artery (PA) compared to aorta. The actual fold range in the coronary artery was 0.5-fold for 6-keto PGF1α to 823-fold for 12,13-DHOME. Data represents organ culture from n = 3–4 separate animals.

